Contour
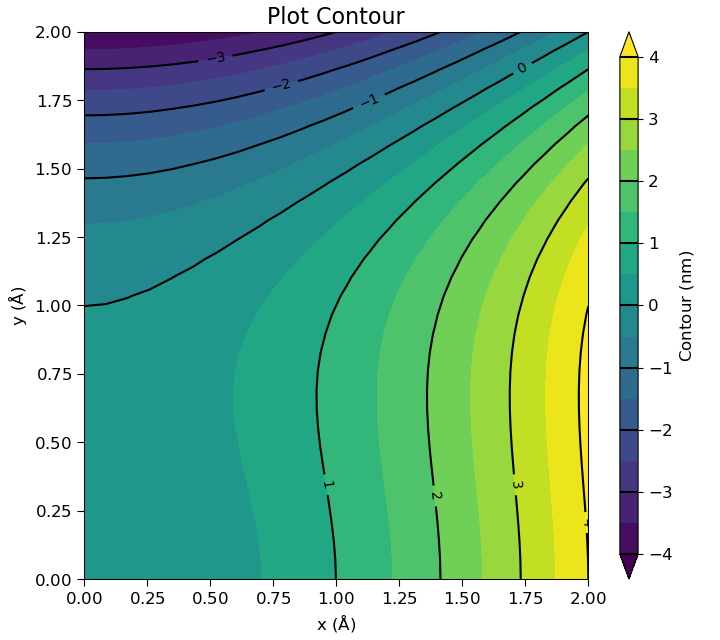
 1# Plot contour
 2# This example creates a contour plot.
 3
 4# Generate some dummy data.
 5xs = numpy.linspace(0, 2, 24) * Angstrom
 6ys = numpy.linspace(0, 2, 30) * Angstrom
 7
 8x_mesh, y_mesh = numpy.meshgrid(xs.inUnitsOf(Angstrom), ys.inUnitsOf(Angstrom))
 9heights = (x_mesh ** 2 + y_mesh ** 2 * (1 - y_mesh)) * nm
10
11# Create a model and apply some settings.
12model = Plot.PlotModel(Angstrom, Angstrom)
13model.framing().setTitle('Plot Contour')
14model.xAxis().setLabel('x')
15model.yAxis().setLabel('y')
16
17# Change x- and y-axis autoscale padding.
18model.xAxis().setAutoscalePadding(0, 0)
19model.yAxis().setAutoscalePadding(0, 0)
20
21# Create and add contour plot.
22contour = Plot.Contour(xs, ys, heights)
23contour.setLabel('Contour')
24contour.setLevels(16)
25contour.setLimits(-4, 4)
26contour.setLabelsVisible(True)
27model.addItem(contour)
28
29# Autoscale.
30contour.setLimits()
31model.setLimits()
32
33# Show the plot for interactive editing.
34Plot.show(model)
35
36# Save the plot (can also be saved to svg, pdf, jpeg or hdf5).
37Plot.save(model, 'contour.png')
References: Plot.Contour, Plot.show, Plot.PlotModel, Plot.save.
↩ Go back to Plots