Line With Fit
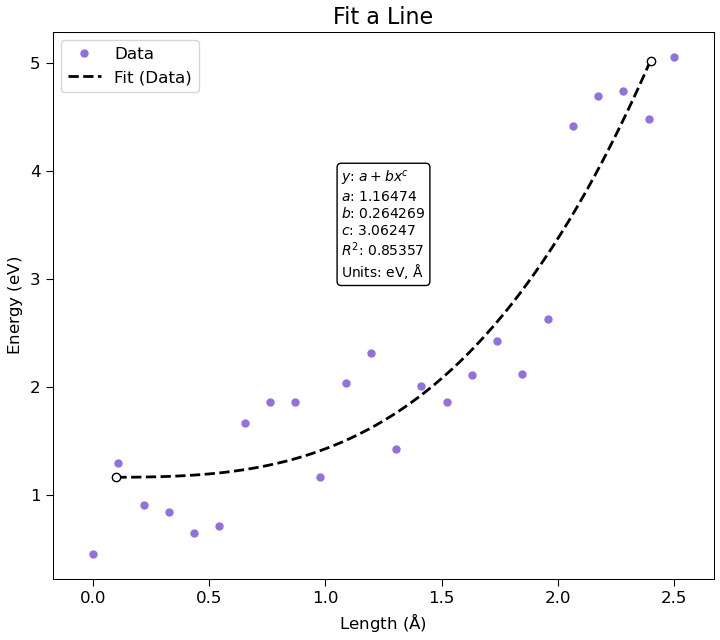
Data fitted to a + b * x ** c
OrderedDict([('a', 1.1647414788164445), ('b', 0.26426912877448744), ('c', 3.062474661222628)])
 1# Plot a line and fit a curve.
 2# This example creates a plot and a fitted curve with a custom expression.
 3# The fit expression and fit parameters are then displayed in an
 4# AttributesLabel in the plot.
 5
 6# The line data.
 7position = [
 8    0.        , 0.10869565, 0.2173913 , 0.32608696, 0.43478261, 0.54347826,
 9    0.65217391, 0.76086957, 0.86956522, 0.97826087, 1.08695652, 1.19565217,
10    1.30434783, 1.41304348, 1.52173913, 1.63043478, 1.73913043, 1.84782609,
11    1.95652174, 2.06521739, 2.17391304, 2.2826087 , 2.39130435, 2.5
12] * Angstrom
13
14energy = [
15    0.45292599, 1.29450797, 0.90624412, 0.84560608, 0.64978286, 0.71261064,
16    1.67142063, 1.85748419, 1.85836352, 1.16352569, 2.03563087, 2.31325527,
17    1.43093584, 2.01424388, 1.86664553, 2.11120909, 2.42706843, 2.12015567,
18    2.62814134, 4.41887562, 4.69864691, 4.73923266, 4.47810888, 5.0582645
19] * eV
20
21# Create a model.
22model = Plot.PlotModel(Angstrom, eV)
23model.framing().setTitle('Fit a Line')
24model.xAxis().setLabel('Length')
25model.xAxis().setAutoscalePadding(0.07, 0.07)
26model.yAxis().setLabel('Energy')
27
28model.legend().setVisible(True)
29
30# Create line.
31line = Plot.Line(position, energy)
32line.setLabel('Data')
33line.setMarkerStyle('o')
34line.setMarkerFaceColor('mediumpurple')
35line.setMarkerEdgeColor('mediumpurple')
36line.setLineStyle(None)
37
38# Create fit and add to line.
39fit = Plot.CurveFit('a + b * x ** c')
40line.addItem(fit)
41
42# By default the fit range contains the entire line. The range can be modified
43# interactively by calling Plot.show(model) and dragging the limits, or it can
44# be done in script:
45fit.setBounds(0.1 * Angstrom, 2.4 * Angstrom)
46
47# Add an AttributesLabel to display the curve fit attributes in the plot.
48attributes = Plot.AttributesLabel(1.25 * Angstrom, 3.5 * eV)
49fit.addItem(attributes)
50
51# Get results.
52print('Data fitted to ' + fit.expression())
53print(fit.parameters())
54
55# Add line to plot.
56model.addItem(line)
57
58# Autoscale limits.
59model.setLimits()
60
61# Show the plot for interactive editing.
62Plot.show(model)
63
64# Save the plot (can also be saved to svg, pdf, jpeg or hdf5).
65Plot.save(model, 'line_with_fit.png')
References: Plot.show, Plot.save, Plot.PlotModel, Plot.AttributesLabel, Plot.CurveFit, Plot.Line.
↩ Go back to Plots