Rolling Average
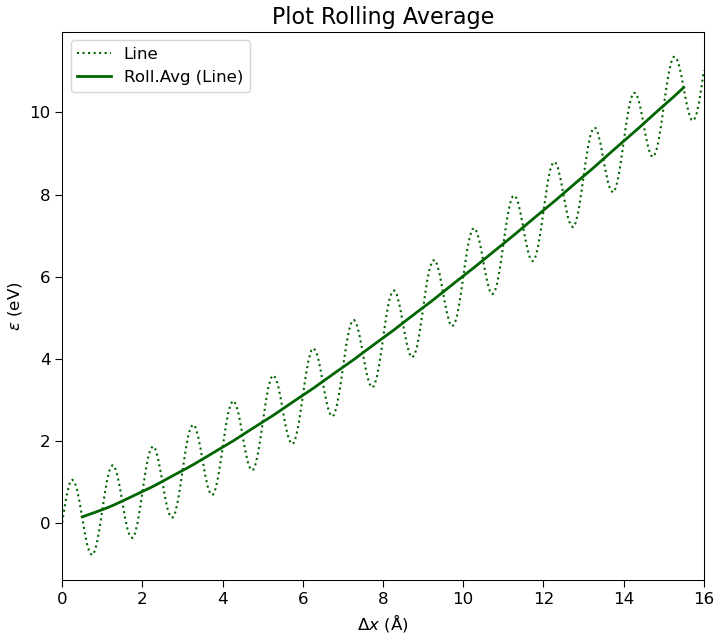
 1# Plot a line and use a Rolling Average to smooth oscillations.
 2
 3# Dummy data with an overlaid oscillation.
 4x = numpy.linspace(0, 16, 256) * Angstrom
 5y = (0.3 * (x / Angstrom) ** 1.3 + numpy.sin(2 * numpy.pi * x / Angstrom)) * eV
 6
 7# Create and tweak model.
 8model = Plot.PlotModel(Angstrom, eV)
 9model.framing().setTitle('Plot Rolling Average')
10model.xAxis().setLabel(r'$\Delta x$')
11model.yAxis().setLabel(r'$\varepsilon$')
12model.legend().setVisible(True)
13
14# Create and add line.
15line = Plot.Line(x, y)
16line.setLabel('Line')
17line.setColor('darkgreen')
18line.setLineWidth(1.5)
19model.addItem(line)
20
21# Create and add rolling average with a window of 16 points.
22roll = Plot.RollingAverage(window=16)
23line.addItem(roll)
24line.setLineStyle(':')
25
26# Autoscale.
27model.setLimits()
28
29# Show the plot for interactive editing.
30Plot.show(model)
31
32# Save the plot (can also be saved to svg, pdf, jpeg or hdf5).
33Plot.save(model, 'rolling_average.png')
References: Plot.RollingAverage, Plot.show, Plot.save, Plot.PlotModel, Plot.Line.
↩ Go back to Plots