Using Thermochemistry Analyzer to Compare Chemical Reactions
Version: T-2022.03
In this tutorial, we will learn how to use the Thermochemistry Analyzer GUI for computing and comparing free energies of chemical reactions. This tool can be used to quickly set up thermochemical calculations of molecules and bulk/surface configurations, import computed thermochemistry data into a database and plot free energy change of reactions.

Background
In any process under study, several chemical reactions take place at the same time and some of them may compete with each other. It is interesting to find out which reaction is more dominant under a given process condition. One way to find the dominant reaction from a group of reactions is to compare their reaction free energies. Free energy (G) of a chemical species indicates the total energy available to it to diffuse, vibrate and react with other species in a medium. Free energies of molecules can be computed under the ideal gas approximation while the free energy of bulk/surface systems can be computed under the quasi-harmonic approximation. A reaction constitutes reactants and products, each of which includes 1 or more species. A reaction free energy (ΔG) is then the difference between the combined free energies of the product species and that of the reactant species. The more negative ΔG is, the more favorable a reaction becomes at that condition and vice-versa. It is to be noted that the ΔG changes with process variables like temperature, pressure and concentration.
In QuantumATK, the Thermochemistry Analyzer GUI provides a one-stop-solution to compute the free energies of the participating species in a reaction using Density Functional Theory (DFT) and, ultimately, compare ΔGs of several reactions. The Thermochemistry analyzer comes with a Thermochemistry Database to store and extend user-generated thermochemical data of different species so the user can compare reactions whenever they want without having to compute/import the thermochemical data every single time.
Getting started
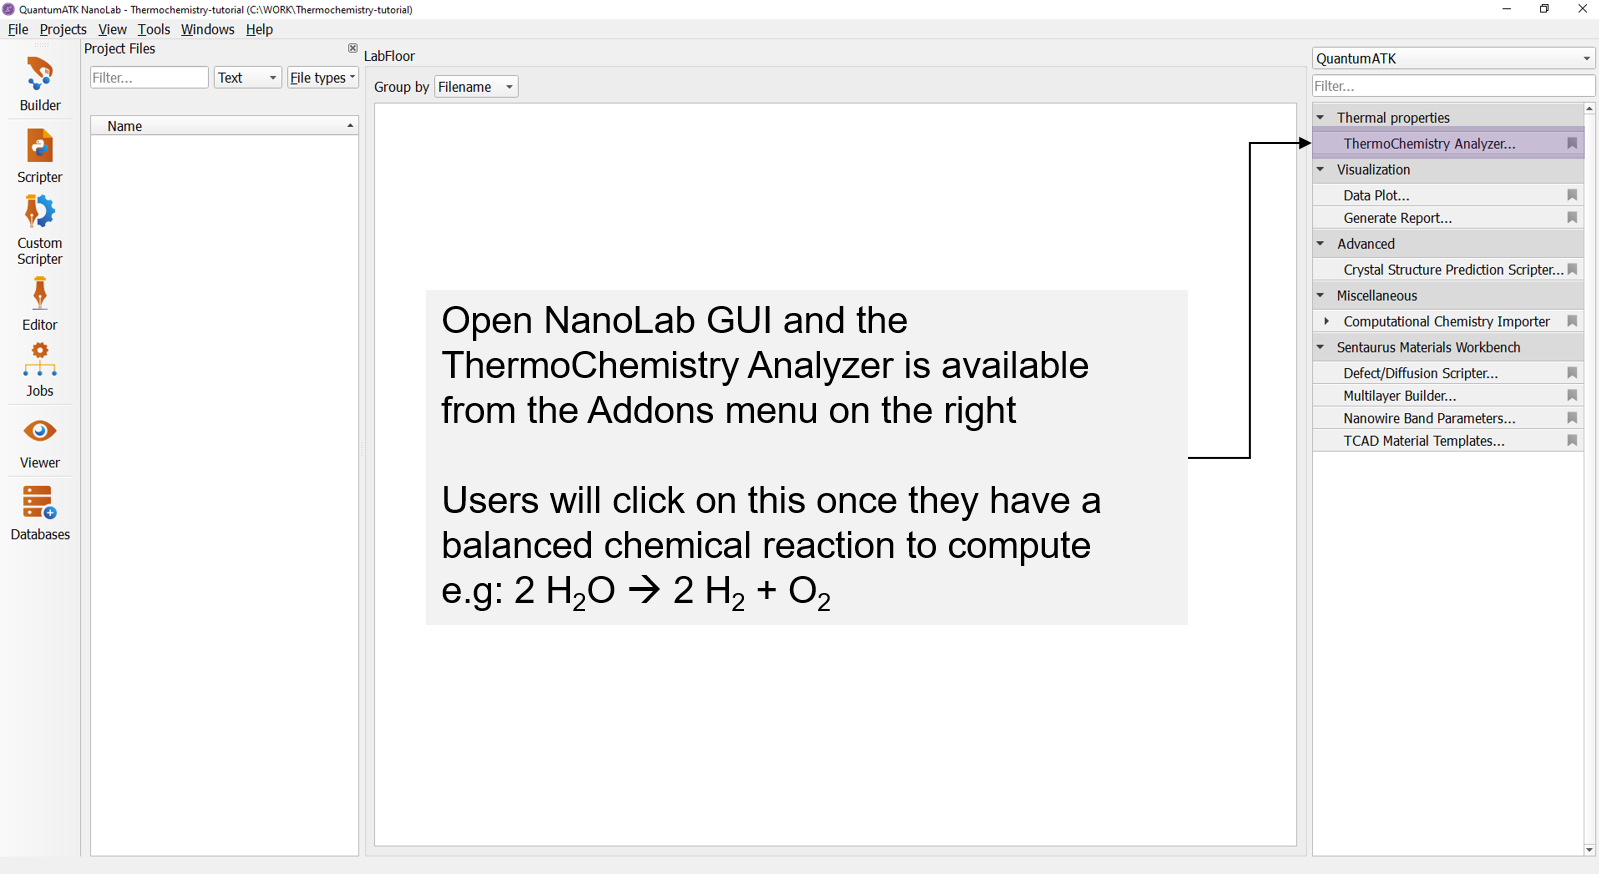
Open the QuantumATK GUI, NanoLab, and click Thermochemistry Analyzer from the supplementary tools menu on the right.
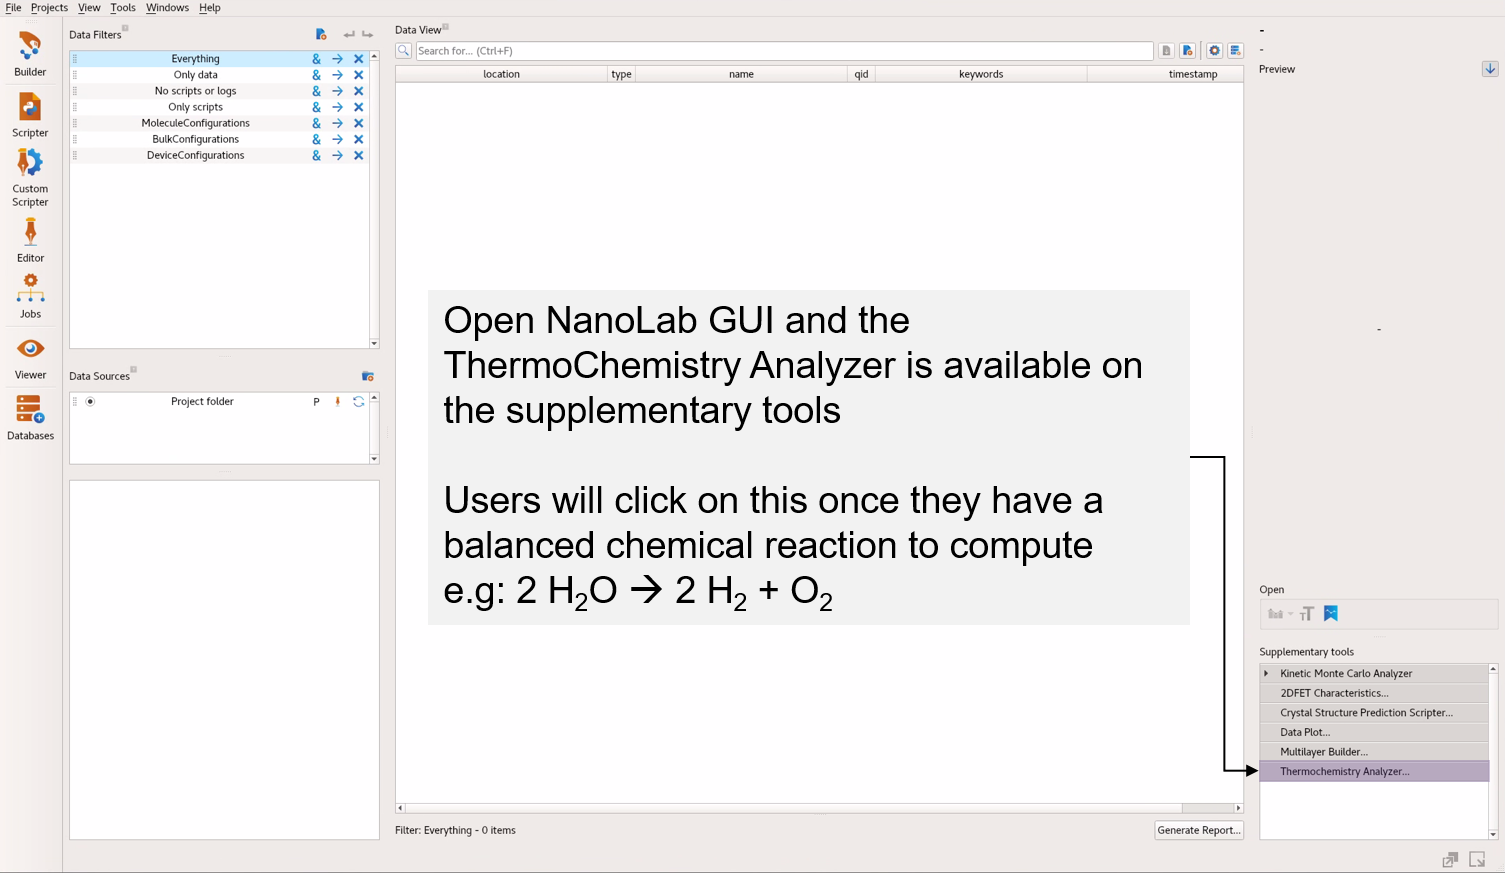
In the S release, it is found in the Addons section to the right.
Understanding the Thermochemistry Analyzer GUI
The GUI of Thermochemistry Analyzer is illustrated in the below image.
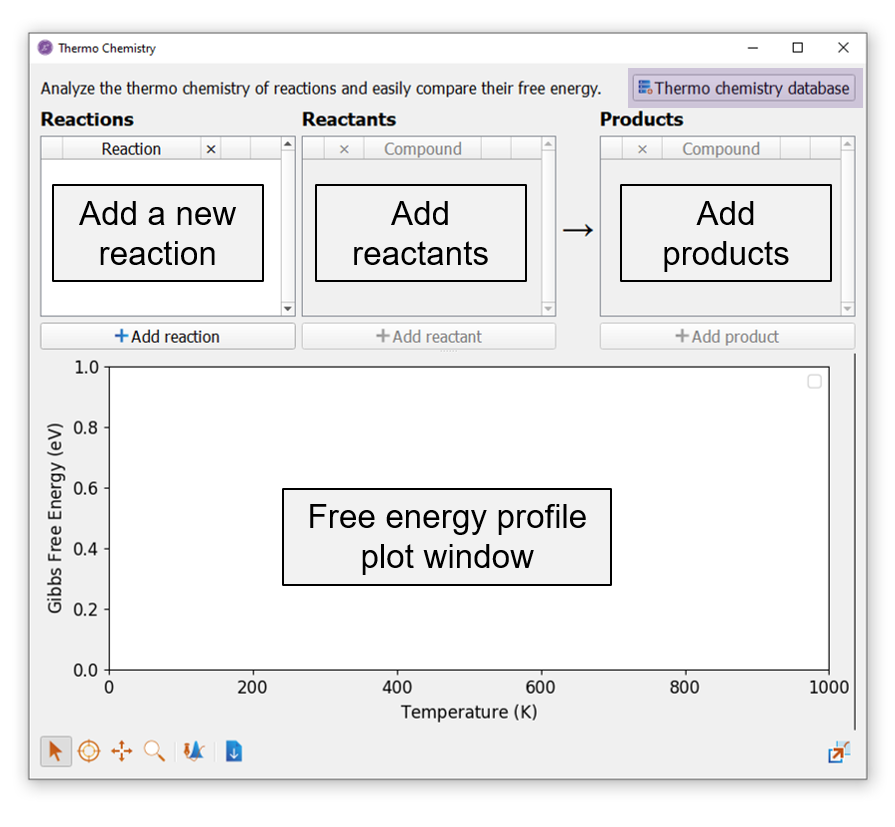
The GUI window has two main regions. The top region is for reaction input, in which the user can add a new reaction by clicking the Add reaction button. The next step is to add the reactant and product species of that reaction one-by-one by clicking the Add reactant and the Add product buttons.
The bottom region is a plot window, which will be updated with curves plotting the free energy of the reaction as a function of temperature. The free energy curves will appear as soon as the user adds the first reactant/product species from the Thermochemistry Database and updates automatically as the other reactant and product species are added.
Access to the Thermochemistry database is allowed by pressing the button at the top right corner of this GUI window highlighted in purple in the above image.
The below image shows an illustration of the Thermochemistry Database.
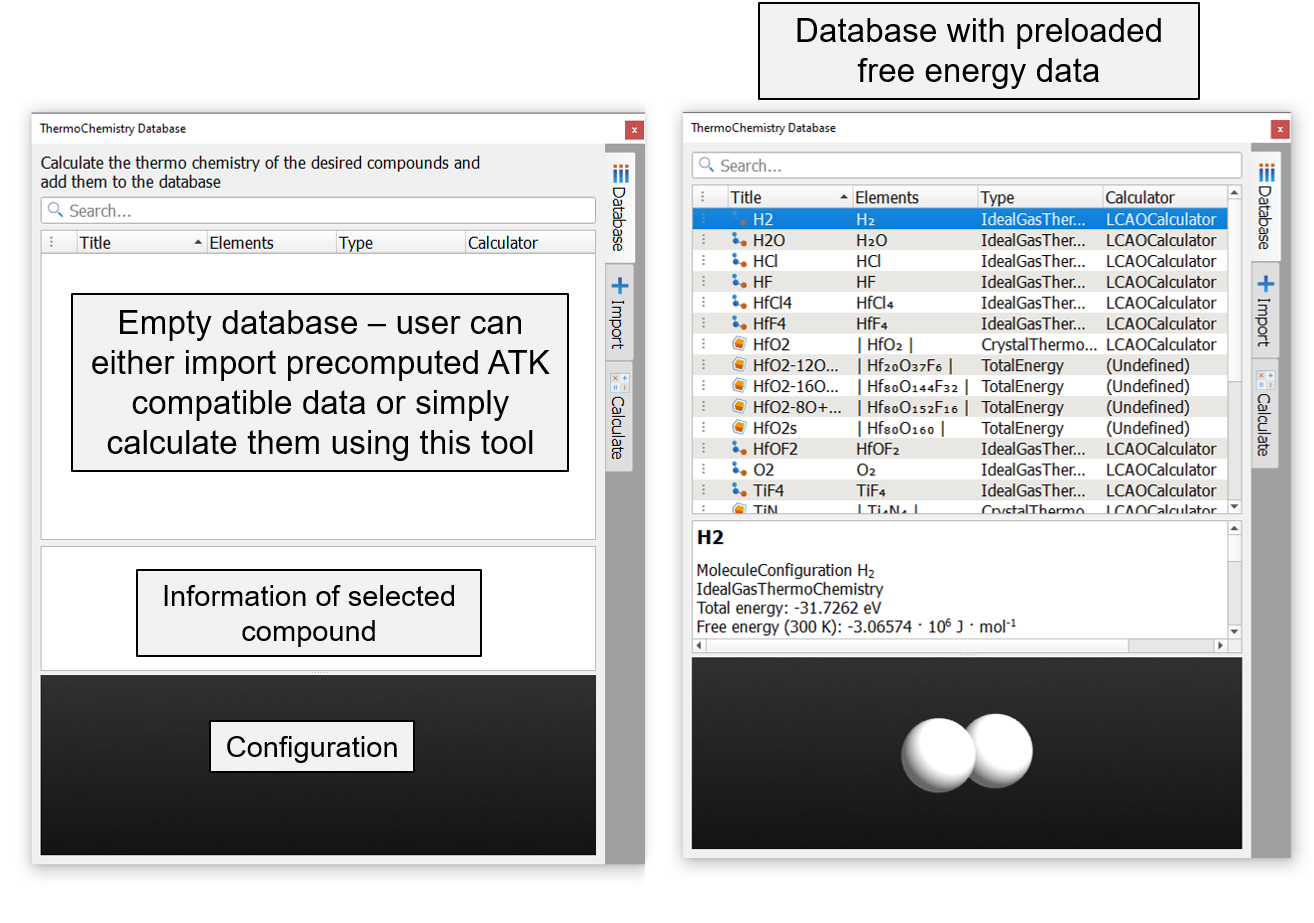
Thermochemistry Database GUI contains three sub-windows titled Database, Import and Calculate.
Database: A place to store thermochemistry data
The thermochemistry data of molecules and bulk/surface models are listed in this sub-window. The data is locally stored in .vnl/databases/thermochemistry. User can copy precomputed ATK compatible database entries to the above folder directly. However, we provide precomputed data for a few molecules, bulk material and surface geometries that will appear as shown in the above image.
The database gives the following information of the species: its user defined name, chemical formula, type of data (ideal gas thermochemistry, crystal thermochemistry or total energy) and the type of calculator used. On selecting any of the entry in the database, its geometry will be shown in the configuration window at the bottom and the settings used to compute its electronic structure will be printed in the text box above it.
Calculate: Setup free energy calculation of a molecule or bulk configuration
Free energy calculation of a species can be set up using this sub-window.
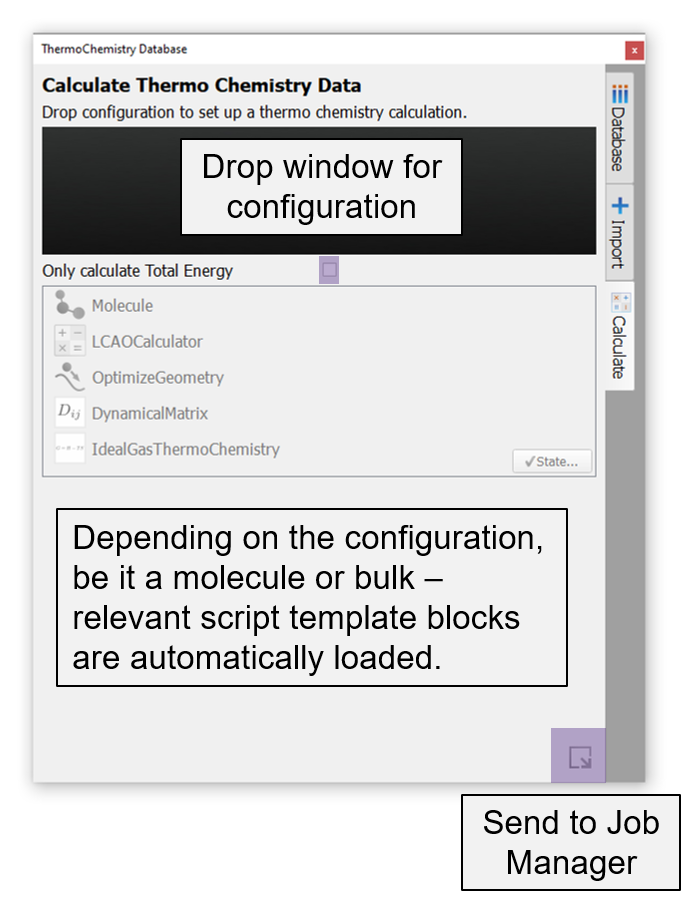
Here, the user will drag and drop a configuration on to the drop window. Depending on the configuration, molecule or bulk, a corresponding script template to compute free energy will be loaded. This template typically contains by default the Configuration, LCAOCalculator with PBE XC functional and Pseudo-Dojo high basis set, OptimizeGeometry block, DynamicalMatrix and IdealGasThermoChemistry for molecule configuration (read Notes) or CrystalThermoChemistry for bulk configuration (read Notes). The user can edit the DFT calculator settings, constraints and tolerance for the geometry optimization and dynamical matrix. The default settings are verified to reproduce free energies reported in JANAF tables for several molecules. The user can select the ‘Only calculate Total Energy’ option to replace the DynamicalMatrix and ThermoChemistry blocks in the scripter with a TotalEnergy object. The job can be submitted to a cluster or local computer via JobManager directly from this sub-window.
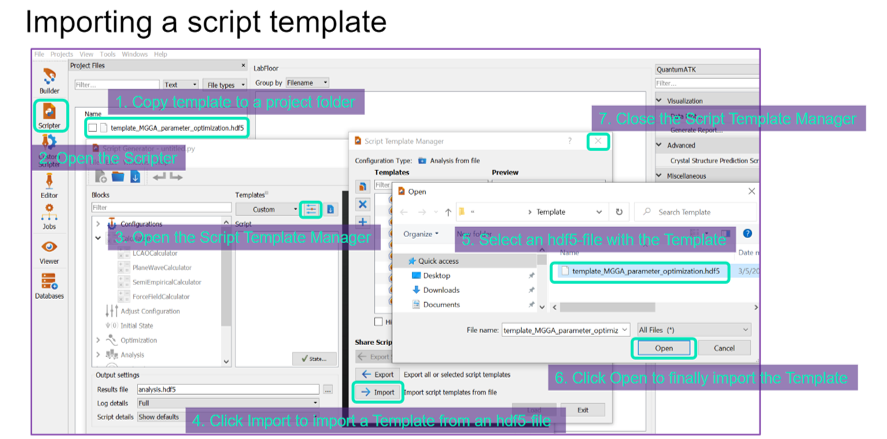
Alternatively, these calculations can also be set up in script generator  using the following templates
 bulk_LCAO_thermochemistry_template.hdf5, molecule_LCAO_thermochemistry_template.hdf5 and surface_LCAO_thermochemistry_template.hdf5 for bulk, molecule and surface configurations, respectively.
When templates are used, the calculator can also be changed. But be careful not to compute free energy using data computed using different calculators. These templates can be loaded to the script generator following the below graphic.
The resulting ThermoChemistry objects from these calculations can be imported to the Thermochemistry Database using the next sub-window.
Import
Once the calculations are finished and loaded on the LabFloor, the free energy/total energy data objects can be imported to the thermochemistry database in this tab in 3 simple steps.
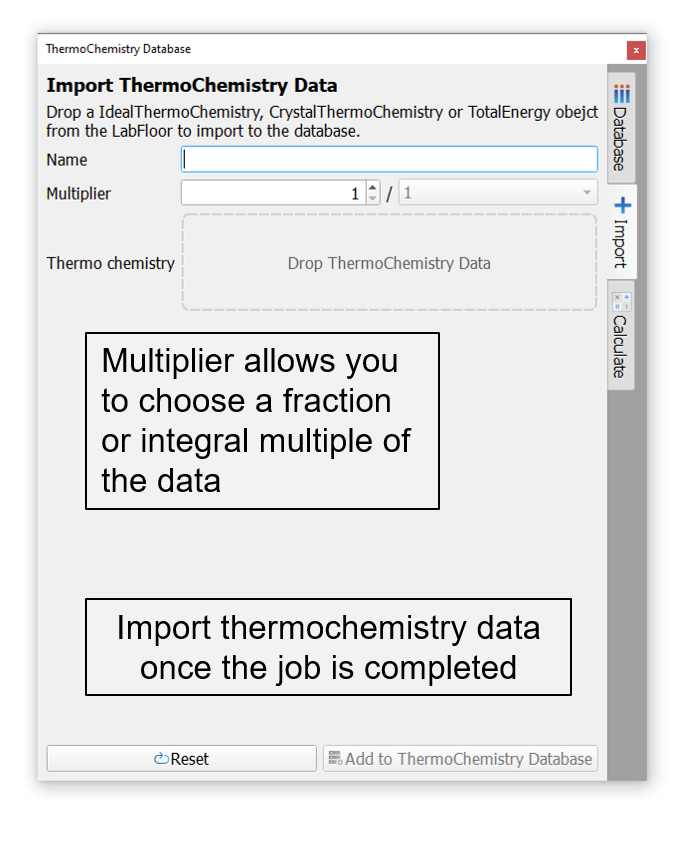
Type a suitable name for the configuration (this is the name used in the reaction equation).
Drop the thermochemistry object on to the drop field and choose a multiplier (fraction or integer). For example, if a bulk configuration has 4 stoichiometric units of the compound, then the user can choose 1/4th of the thermochemistry data to correspond to one stoichiometric unit of the material.
Finally, click ‘Add To ThermoChemistry Database’ button. The entry will appear in the Thermochemistry Database.
Example: Temperature Window for Thermal Atomic Layer Etching of HfO2 and ZrO2 
To demonstrate the Thermochemistry Analyzer, we will try to reproduce the free energy curves published by Mullins et al. [1] in which hydrogen fluoride (HF) gas interacts with either the bulk or surface of HfO2 and ZrO2 . We use the same geometries as the ones used in the publication and they are preloaded in the thermochemistry database along with their free energy data computed using QuantumATK as explained above. For surface geometries, we only use the total energy with the assumption that the free energy contributions from the reactant and product surfaces effectively cancel each other.
For the first reaction, let us consider etching of HfO2 bulk using HF. The reaction is HfO2 + HF -> HfF4 + H2 O . The below video shows how this can be done using the Thermochemistry Analyzer GUI in Quantum ATK.
We follow the same procedure and add corresponding reactions for HF interaction with HfO2 surface, ZrO2 bulk and ZrO2 surface and the resulting free energy plot is shown below. We used the data entries from the thermochemistry database titled ‘HfO2s’ and ‘ZrO2s’ for the bare HfO2 and ZrO2 surface models, respectively and used ‘HfO2-8O+16F’ and ‘ZrO2-8O+16F’ for the fluorinated HfO2 and ZrO2 surface models, respectively. The reactions studied are described in the image below.
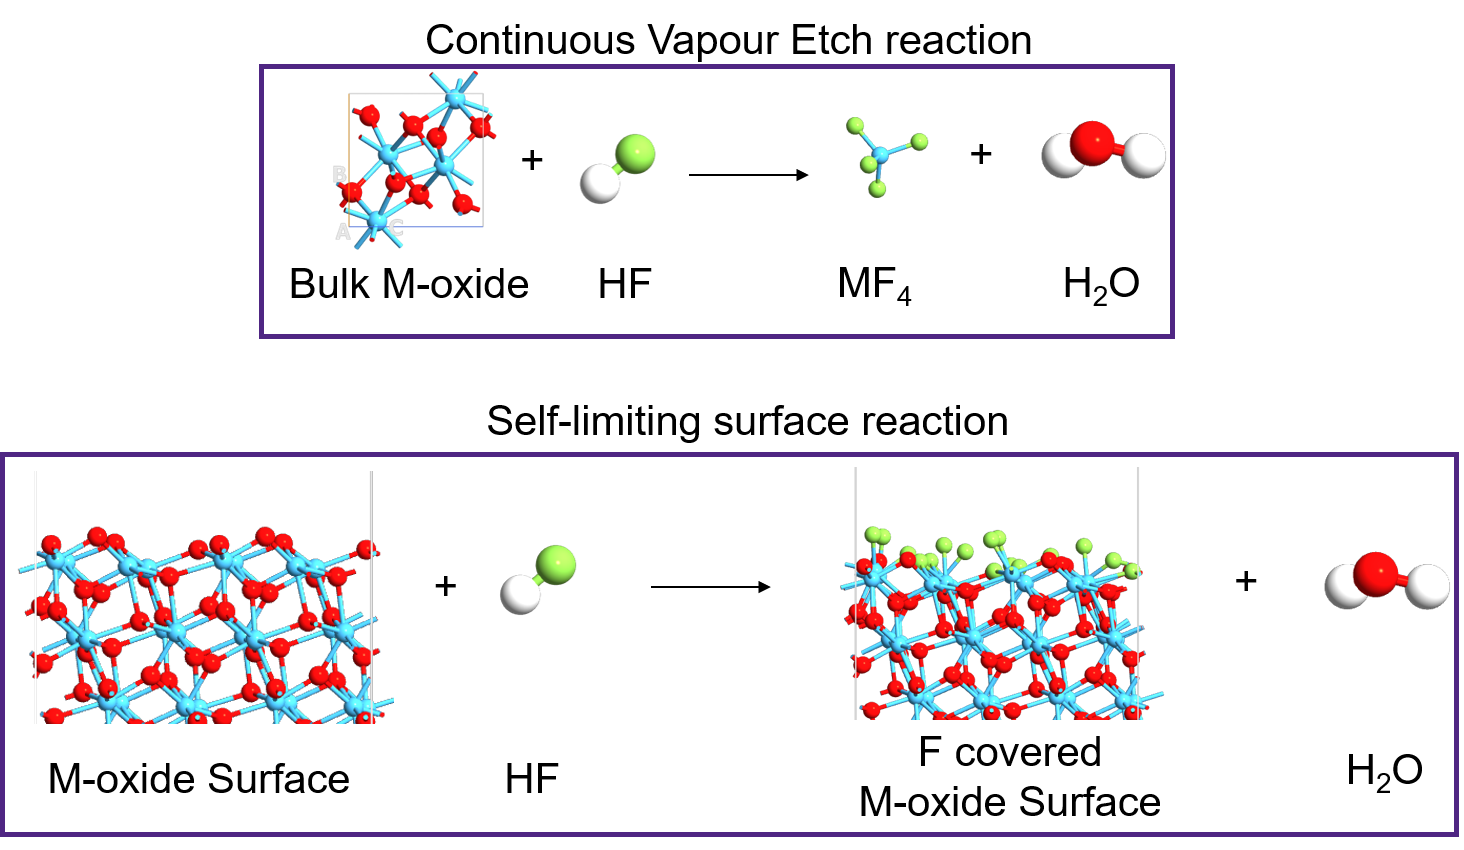
The bulk to gas reaction is termed as continuous vapour etching (CVE) reaction and the surface to surface reaction is termed as self-limiting (SL) reaction.
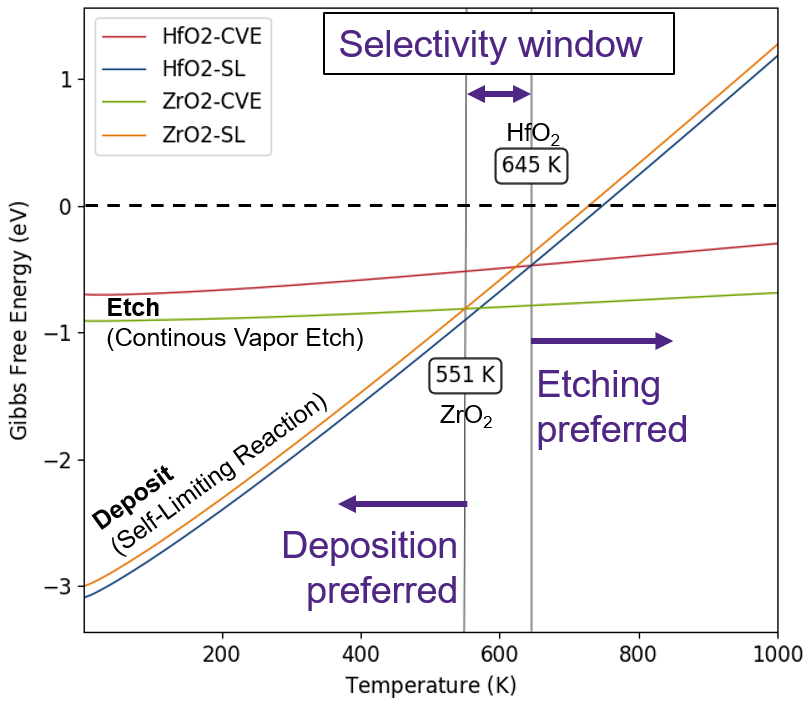
The free energy profiles (ΔG vs T) of CVE and SL reactions of a material will intersect at some temperature at which both reactions are equally probable. The reaction that has the lowest ΔG value is more favourable at other temperatures. The crossover temperature for HfO2 and ZrO2 are found to be 645 K and 551 K, respectively. The corresponding values in the reference paper are 657 K and 534 K, obtained using PAW based plane wave code.
Below 551 K, HF passivates both HfO2 and ZrO2 surfaces and starts etching both materials beyond 645 K, of course subject to kinetic barriers. Between 551 K and 645 K, there is a selectivity window where HF passivates HfO2 but etches ZrO2 . Please keep in mind that this is only a thermodynamic study and kinetics could still make the reactions difficult to proceed at these temperatures. Nevertheless, they help immensely to screen reactant chemicals and specific reactions for indepth kinetic analysis.
General Uses
Apart from applications to process development, thermochemistry analyzer can be used for any general ab initio thermodynamic studies such as finding stable phases, reaction paths, gas-sensing of materials and so on. Since total energy objects can be stored in the database, one can also use it to compute and compare binding/adsorption/desorption energies.