Scatter And Bars
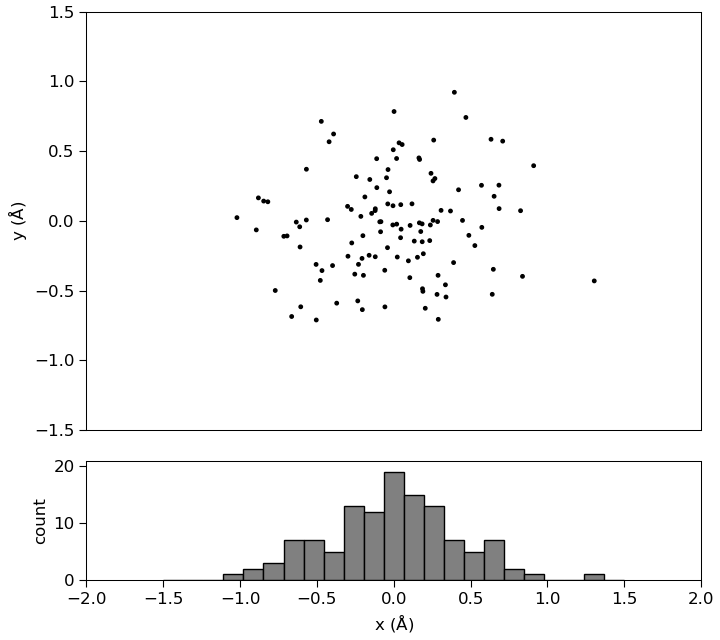
 1# Plot a scatter plot and histogram of the same data, in two different
 2# plot frames.
 3
 4# Data
 5xs = [
 6     0.83735136, -0.03760732,  0.64764615, -0.56916293,  0.16771351,  0.36879221,
 7    -0.60997142,  0.25521883,  0.11830685,  0.25563545, -0.12038023, -0.37151165,
 8    -0.39852745,  0.04760468,  0.01874401, -0.14411779, -0.47167539,  0.09492484,
 9    -1.0206757 , -0.20679976,  0.64055442, -0.11149991, -0.8195419 , -0.71561298,
10     0.20467069,  0.04404555, -0.12067043, -0.00652415,  0.1842815 ,  1.30424258,
11     0.18665118,  0.33963749, -0.50445047,  0.23366367,  0.16632812, -0.18822706,
12    -0.03928118,  0.28480758, -0.77132285, -0.46731356, -0.00351658,  0.57264734,
13     0.4690202 ,  0.39410025, -0.05785553,  0.38895173, -0.60553757,  0.65265759,
14     0.68512054,  0.82472603, -0.42096647, -0.39180296,  0.13309577, -0.08609454,
15     0.2812388 ,  0.90992544, -0.0474478 , -0.05890777, -0.63456302, -0.2440444 ,
16    -0.88108586, -0.08369874,  0.2674326 , -0.43100448, -0.56871021,  0.52732416,
17    -0.69443328, -0.20111549, -0.84669947, -0.16063656,  0.16344137,  0.10416594,
18     0.03419954, -0.6121973 ,  0.57048945, -0.23452936, -0.27359465,  0.24200477,
19     0.04523835, -0.25387563, -0.66462862, -0.29825646,  0.10609641, -0.02768023,
20     0.19217027,  0.70849361,  0.01809639, -0.09136528,  0.05425135, -0.47819754,
21    -0.27667665,  0.02260149, -0.12150936, -0.04109076,  0.33587457,  0.6325594 ,
22     0.48836006,  0.28791998, -0.30082755,  0.15389378,  0.44696974,  0.42120839,
23    -0.1975828 , -0.22986685,  0.18926104, -0.89475401, -0.11048363, -0.21441636,
24    -0.50558513,  0.30749674, -0.15624408,  0.00163378, -0.20476512,  0.28942828,
25     0.23776839, -0.00519347,  0.18484562,  0.17532173,  0.2595802 ,  0.68402716
26] * Angstrom
27
28ys = [
29    -0.39715421,  0.36792564, -0.34670964,  0.00663009,  0.44020473,  0.07102315,
30    -0.18666689,  0.28657916,  0.12237538,  0.00391008,  0.08724919, -0.5892403,
31    -0.31992659, -0.05920487, -0.023152  ,  0.05400336,  0.71322692, -0.28597838,
32     0.02357725, -0.2685703 , -0.52583313,  0.44584184,  0.13713652, -0.11021891,
33    -0.62578892, -0.12033264, -0.25678569, -0.02885627, -0.02127524, -0.42985407,
34    -0.48594983, -0.54523483, -0.70977806, -0.14108246, -0.01369695,  0.17182939,
35     0.12188442, -0.00476866, -0.49848981, -0.35582173,  0.50985858, -0.04619683,
36     0.74132604,  0.92157524, -0.61588049, -0.29860316, -0.61532293,  0.17643255,
37     0.08809562,  0.07311062,  0.56711457,  0.62286086, -0.14466861, -0.07766289,
38    -0.52641952,  0.39565981,  0.30934238, -0.35355341, -0.00837116,  0.31705944,
39     0.16510211, -0.00542853,  0.30364316,  0.00874412,  0.3702261 , -0.17669301,
40    -0.10746404, -0.10582702,  0.14214246, -0.24628123,  0.45151432, -0.4065585 ,
41     0.559458  , -0.04214145,  0.25515366, -0.57307117, -0.15778443,  0.34097717,
42     0.11634075, -0.38137623, -0.68484207, -0.25304297, -0.03233032,  0.20868762,
43    -0.23503984,  0.57160049,  0.44713183, -0.00655961,  0.54723515, -0.42624796,
44     0.08212732, -0.25878557,  0.07400322, -0.19167848, -0.4577302 ,  0.58497679,
45    -0.10335792, -0.38983413,  0.1043278 , -0.2605955 ,  0.00364975,  0.22308884,
46    -0.38997689, -0.31123183, -0.50457249, -0.06438019,  0.23835865,  0.03252147,
47    -0.31160181,  0.0756    ,  0.29678598,  0.78384221, -0.63570551, -0.7051451 ,
48    -0.02914059,  0.10867163, -0.14926761, -0.07602382,  0.57902892,  0.25606282
49] * Angstrom
50
51# Create models.
52model = Plot.PlotModel(Angstrom, Angstrom)
53model.xAxis().setVisible(False)
54model.yAxis().setLabel('y')
55
56model_x = Plot.PlotModel(x_unit=Angstrom)
57model_x.xAxis().setLabel('x')
58model_x.yAxis().setLabel('count')
59model_x.yAxis().setAutoscalePadding(0, 0.1)
60
61# Build and add scatter plot
62scatter = Plot.Scatter(xs, ys)
63scatter.setLabel('Scatter')
64
65model.addItem(scatter)
66
67# Add histogram as for x-values.
68x_bins = numpy.linspace(-1.5, 1.5, 24, endpoint=True) * Angstrom
69x_counts = numpy.histogram(
70    xs.inUnitsOf(Angstrom),
71    x_bins.inUnitsOf(Angstrom)
72)[0]
73model_x.addItem(Plot.VerticalBar(x_bins, x_counts))
74
75# Change limits.
76model.setLimits('x', -2, 2)
77model.setLimits('y', -1.5, 1.5)
78model_x.setLimits('y')
79
80# Create layout.
81layout = Plot.GridLayout(rows=4, columns=1)
82layout.setMode(Plot.LAYOUT_MODES.SHARE_X)
83
84# Add main model.
85frame = Plot.PlotFrame(use_frame_model=False)
86frame.addModel(model)
87layout.addItem(frame, row=0, column=0, height=3, width=1)
88
89# Add x model.
90layout.addModel(model_x)
91
92# Show the plot for interactive editing.
93Plot.show(layout)
94
95# Save the plot (can also be saved to svg, pdf, jpeg or hdf5).
96Plot.save(layout, 'scatter_and_bars.png')
References: Plot.GridLayout, Plot.show, Plot.save, Plot.PlotModel, Plot.VerticalBar, Plot.Scatter, Plot.PlotFrame.
↩ Go back to Plots