Filled Area
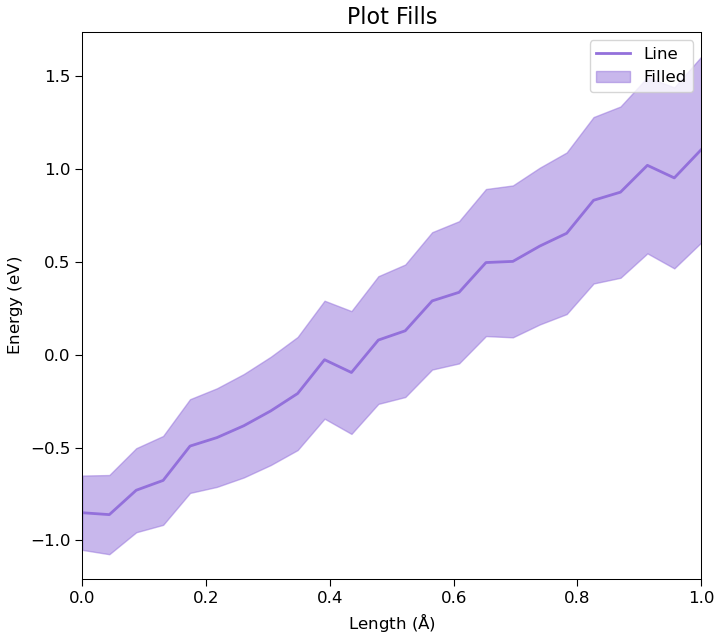
 1# Plot filled area
 2# This example creates a simple plot with a line and a fill area.
 3
 4# Generate some dummy data.
 5position = numpy.linspace(0, 1, 24) * Angstrom
 6energy = (numpy.linspace(-1, 1, 24) + 0.2 * numpy.random.rand(24)) * eV
 7energy_error = numpy.linspace(0.2, 0.5, 24) * eV
 8
 9# Create a model.
10model = Plot.PlotModel(Angstrom, eV)
11model.framing().setTitle('Plot Fills')
12model.legend().setVisible(True)
13model.xAxis().setLabel('Length')
14model.yAxis().setLabel('Energy')
15
16# Create line.
17line = Plot.Line(position, energy)
18line.setColor('mediumpurple')
19line.setLabel('Line')
20line.setLineWidth(2)
21model.addItem(line)
22
23# Create and add fill area.
24fill = Plot.HorizontalFill(position, energy - energy_error, energy + energy_error)
25fill.setLabel('Filled')
26fill.setColor('mediumpurple')
27fill.setAlpha(0.5)
28model.addItem(fill)
29
30# Autoscale.
31model.setLimits()
32
33# Show the plot for interactive editing.
34Plot.show(model)
35
36# Save the plot (can also be saved to svg, pdf, jpeg or hdf5).
37Plot.save(model, 'filled.png')
References: Plot.show, Plot.save, Plot.PlotModel, Plot.HorizontalFill, Plot.Line.
↩ Go back to Plots