Multiple Axes
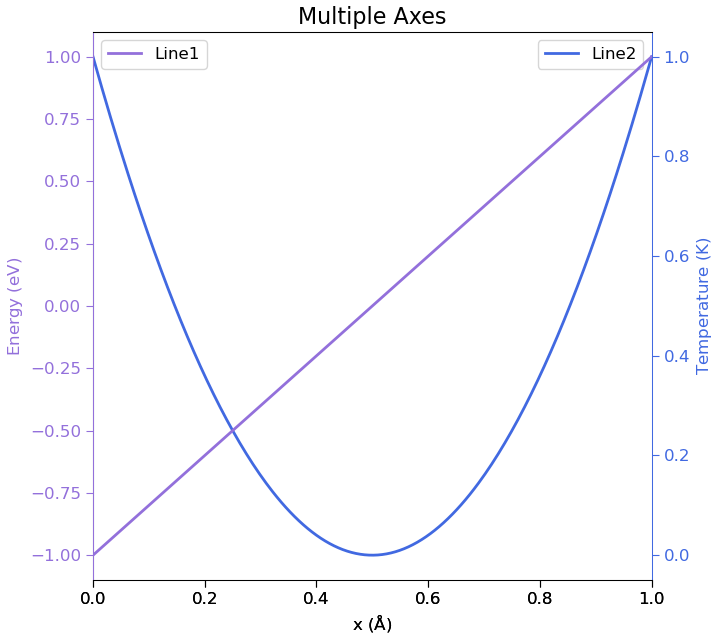
 1# Plot lines in two different plots, with overlaid axis.
 2
 3# Data
 4xs = numpy.linspace(0, 1, 256) * Angstrom
 5ys1 = numpy.linspace(-1, 1, 256) * eV
 6ys2 = numpy.linspace(1, -1, 256) ** 2 * Kelvin
 7
 8# Create model1 and add line.
 9model1 = Plot.PlotModel(Angstrom, eV)
10model1.framing().setTitle('Multiple Axes')
11model1.framing().setBorders(show_right_border=False)
12model1.xAxis().setLabel('x')
13model1.yAxis().setLabel('Energy')
14model1.yAxis().setColor('mediumpurple')
15model1.legend().setVisible(True)
16
17line1 = Plot.Line(xs, ys1)
18line1.setLabel('Line1')
19line1.setColor('mediumpurple')
20line1.setLineWidth(2)
21model1.addItem(line1)
22
23# Create model2 and add line.
24model2 = Plot.PlotModel(Angstrom, Kelvin)
25model2.xAxis().setLabel('x')
26model2.yAxis().setLabel('Temperature')
27model2.yAxis().setMirrored(True)
28model2.yAxis().setColor('royalblue')
29model2.legend().setVisible(True)
30
31line2 = Plot.Line(xs, ys2)
32line2.setLabel('Line2')
33line2.setColor('royalblue')
34line2.setLineWidth(2)
35model2.addItem(line2)
36
37# Autoscale.
38model1.setLimits()
39model2.setLimits()
40
41# Create layout.
42layout = Plot.OverlayLayout()
43layout.setMode(Plot.LAYOUT_MODES.SHARE_X)
44
45# Add main model.
46frame1 = Plot.PlotFrame(use_frame_model=False)
47frame1.addModel(model1)
48layout.addItem(frame1)
49
50frame2 = Plot.PlotFrame(use_frame_model=False)
51frame2.addModel(model2)
52layout.addItem(frame2)
53
54# Show the plot for interactive editing.
55Plot.show(layout)
56
57# Save the plot (can also be saved to svg, pdf, jpeg or hdf5).
58Plot.save(layout, 'multiple_axes.png')
References: Plot.OverlayLayout, Plot.show, Plot.save, Plot.PlotModel, Plot.Line, Plot.PlotFrame.
↩ Go back to Plots