2D Database and potentials
Version: X-2025.06
In this tutorial, you will learn how to use structures from the 2D materials database integrated in QuantumATK Nanolab and how to couple them with corresponding potential sets made specifically for the structures in the database. Here, it will be exemplified with a SiO 2D-structure and a corresponding Stillinger-Weber potential [1] for which its phonon bandstructure is determined.

Importing a Structure from the 2D Materials Database
The following step-by-step protocol describes how to import a SiO 2D-structure from NanoLab’s Internal Database.
In the
 Builder Stash (1), click on the
  Add button (2) and choose From Database… (3).
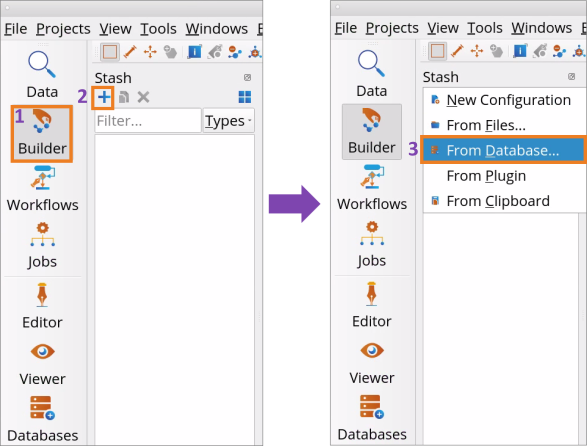
Navigate to the 2D materials Database tab and use the
 Search bar (1) to find the SiO (buckled) structure (2). Then click on the Add button (3) to add the structure to the Builder Stash.
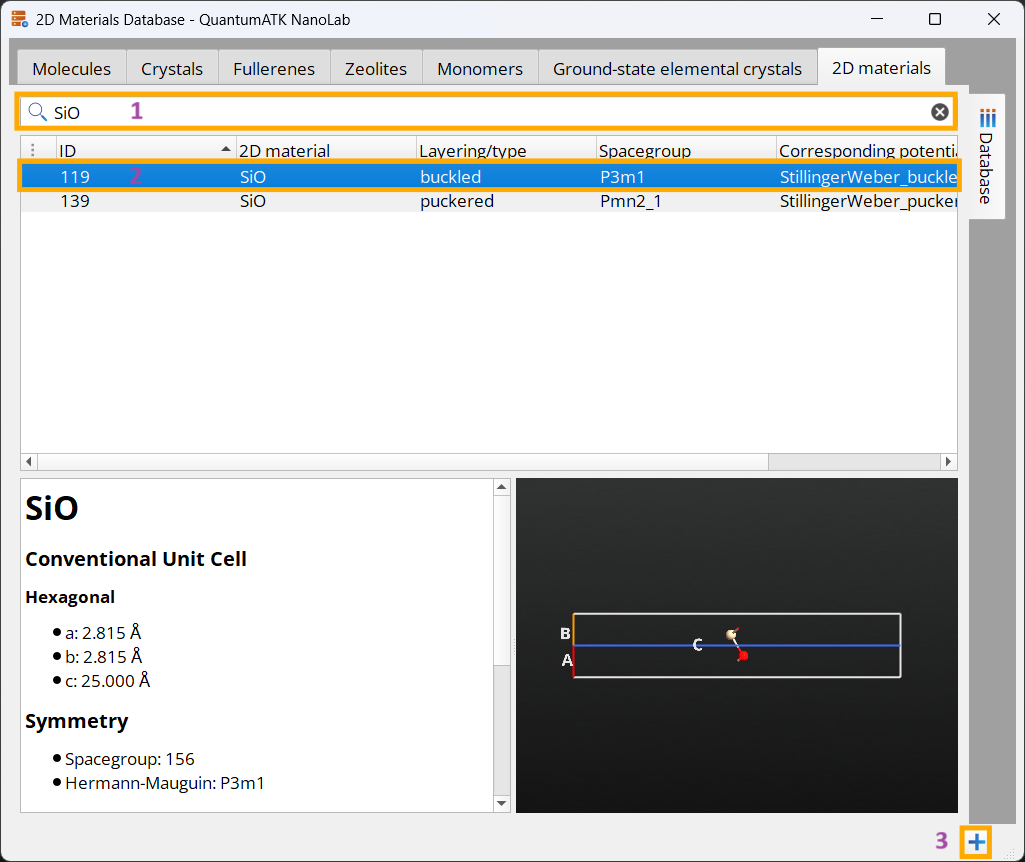
Creating and Setting a Calculator from a 2D Potential Set
In order to set up a forcefield calculator from a potential set corresponding to the structure, the following steps are taken.
In the
Builder, use the  Send content to other tools button to send the imported buckled SiO structure to the
  Workflow Builder.
Go to the Block Catalog ‣ QuantumATK tab ‣ Calculators category on the right hand panel and drag-and-drop the
 SetForceFieldCalculator block to the middle Workflow Area ‣ Build tab.
Double-click on the
SetForceFieldCalculator block and change the Potential set type from Pre-defined potential set to Custom potential set (1). In the Custom potential set menu, click the Add button under Potential Components (2) and click the Choose 2D potential set… option (3) to open a menu for choosing a predefined 2D potential set.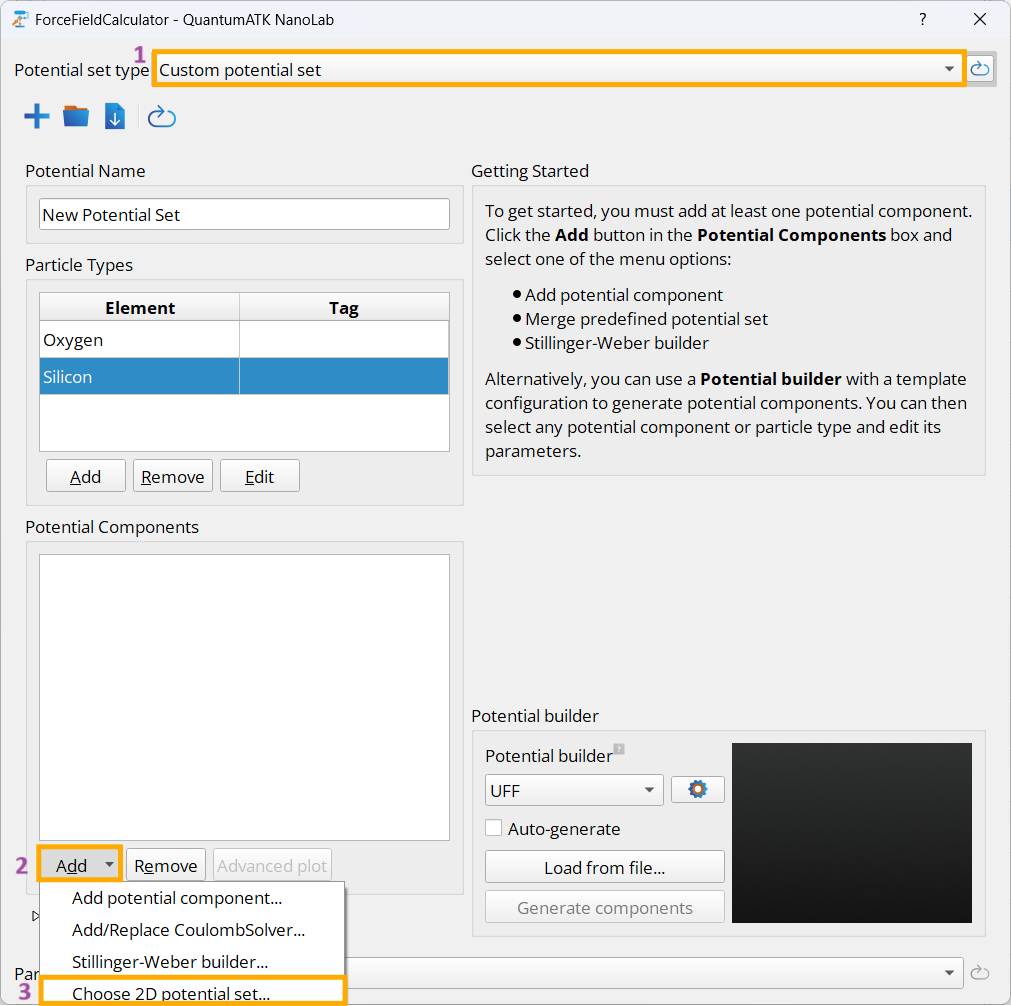
Use the Filter bar (1) to search for the Stillinger-Weber potential set corresponding to the buckled SiO structure. Marking the potential set (2) and clicking on the
Add button (3) adds the potential set to the calculator of the SetForceFieldCalculator block.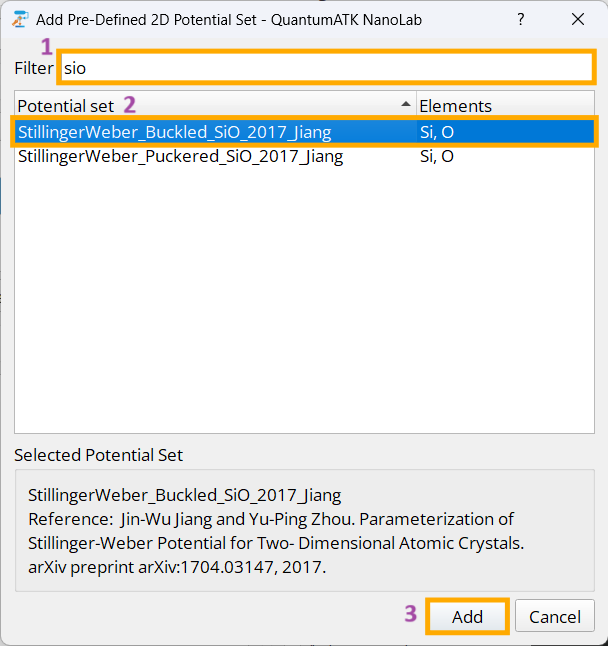
Note
Most 2D potential sets require specific tags to be present on the structure. These tags are automatically attached on the corresponding structure in the 2D materials database. If a different or a custom structure is used, where one or more tags are missing on the structure, the forcefield calculator block will throw an error highlighting the tag requirement that is not fulfilled. It is possible to circumvent this error by clicking the checkbox field Ignore 2D tags error that will appear in the Custom potential set menu. This allows the potential set to be scripted for visual inspection. It should be noted that the script will still not be able to complete any calculations with this setting selected, as long as any tag remain missing.
Phonon Bandstructure calculation
Now that a calculator based on the appropriate potential set has been attached to the 2D structure, any desired calculation can follow. In this example workflow, we will calculate the phonon bandstructure. This usually requires a geometry optimization with a tight tolerance for accurate results. The forcefield-structure pair is however already optimized to within an even tighter tolerance than we will use here. Nevertheless, an optimzation step is included for completeness.
In the
Workflow Builder, add an Optimization and Dynamics ‣ OptimizeGeometry block. Set the Force tolerance to 0.001 eV/Å in the menu.Add an Analysis ‣ PhononBandstructure block. This will automatically add a required DynamicalMatrix input block. These blocks will not be discussed in more detail here - see DynamicalMatrix and PhononBandstructure documentation or related tutorials for more information.
Analyzing Results
Once the calculation has finished, the results can be analyzed.
Go to the
Data View tool.Since the optimization converged after the first step, no additional optimization steps were taken. This can be confirmed by inspecting the original and optimized lattice constants in text representation. In Data Sources select the file
BuckledSio_2017_results.hdf5(or equivalent if a different destination filename has been used) and then in Data View window select both BulkConfiguration_0 (initial geometry) and optgeom (optimized geometry), followed by a right-click to Open All with Text Representation. As expected we find the that lattice constants of the 2D buckled SiO remained at values of a=2.815 Å and c=25.000 Å.
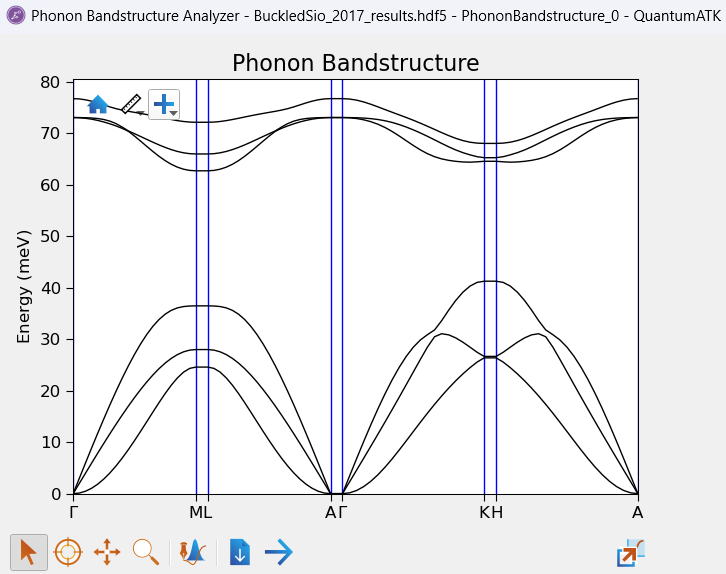
Right-click on the phonon bandstructure PhononBandstructure_0 in Data View and choose to Open with Phonon Bandstructure Analyzer. This will display the phonon bandstructure for the simple 2D unit cell.