Visualize the LUMO state of a water molecule
In this tutorial you will learn how to visualize a molecular orbital. As an example, you will visualize the LUMO state of water molecule. Specifically, you will:
Build the molecule.
Compute a single point calculation at the DFT level.
Obtain the molecular eigenenergy spectrum and visualize the LUMO state.
Building the molecule
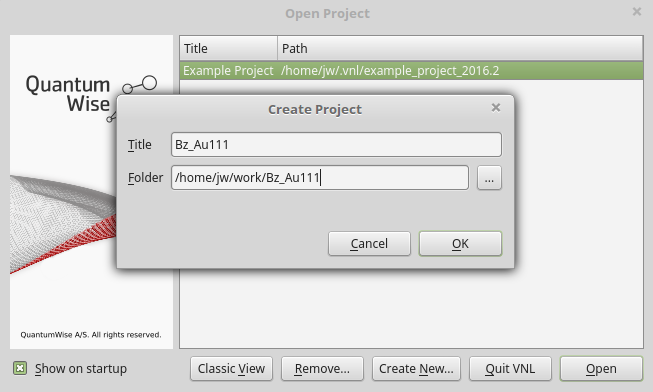
Open QuantumATK and create a new project by clicking Create New. Give the project a Title (here: “Water_LUMO”), select the folder where data will be stored, then click OK and Open to start the project.

In the QuantumATK main window, click on the
 icon to open the Builder.
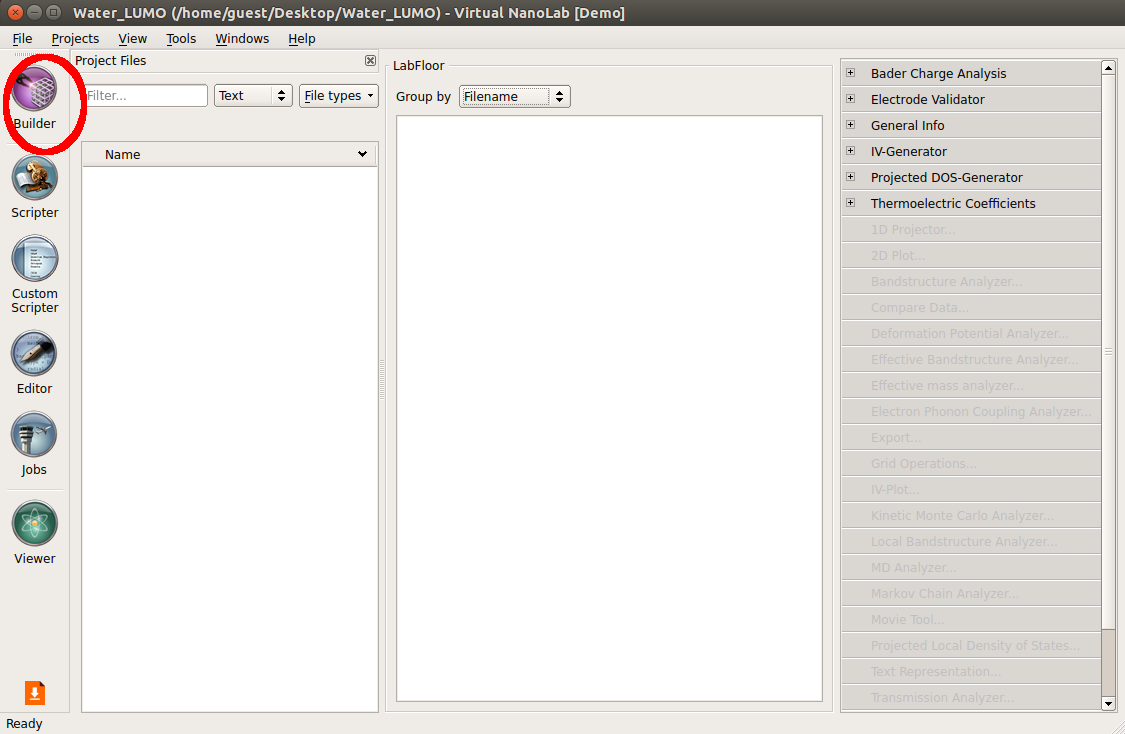
Go to the Stash, click . A hydrogen atom appears in the Stash and in the preview window of the Builder.
Go to . Tick the Copy option, increase Z to 1 Å, and click the Apply button twice to add two more hydrogen atoms.
Go to the preview window. Press
Ctrl+Rto center the view and select the atom in the middle. Use the Modify Element tool
in the toolbar to change it to oxygen.
Modify Element tool
in the toolbar to change it to oxygen.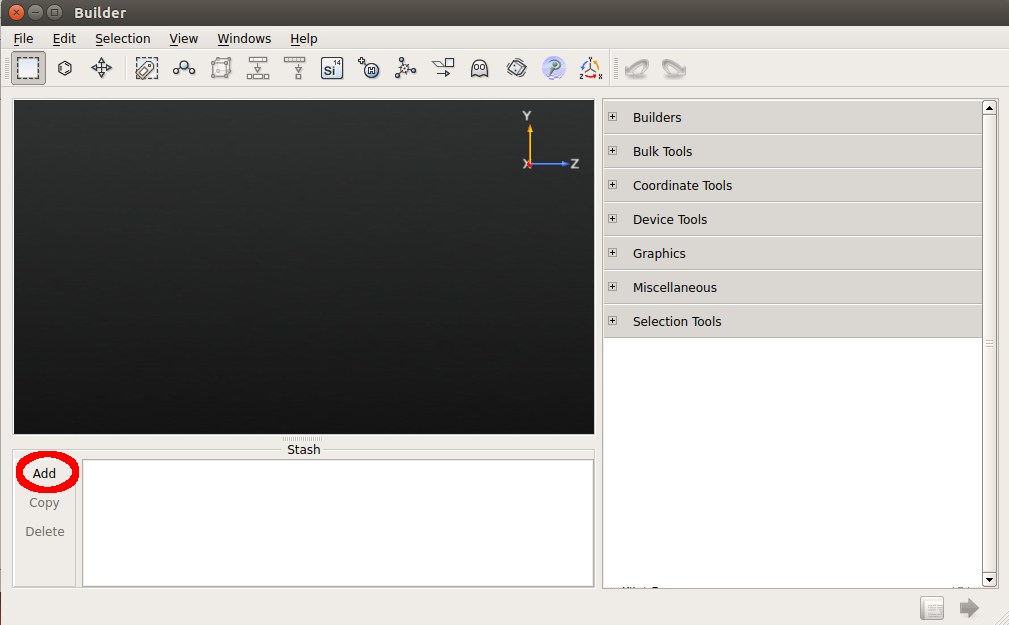
Select all atoms using the left mouse button while holding down the
Ctrlbutton of your keyboard. Go to and set the distances and angles as shown in the picture below (H-O distance 0.972278 Å and H-O-H angle 102.75 degrees).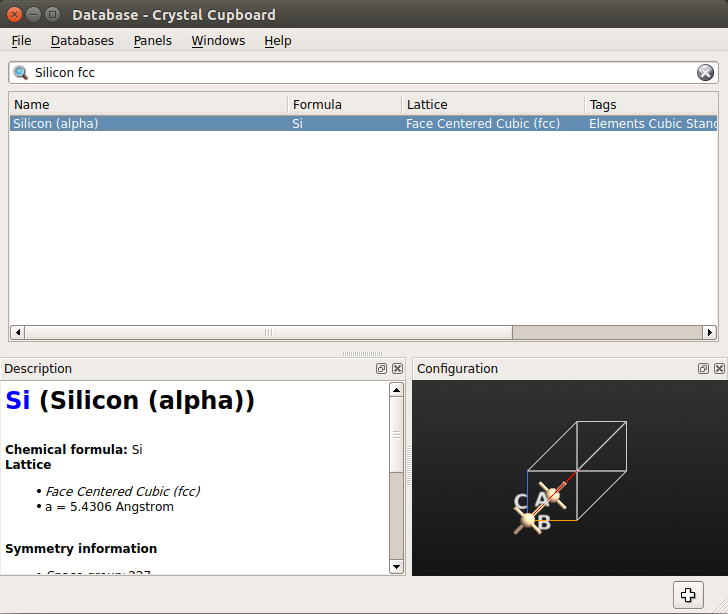

You have now built the water molecule completely from scratch!
Note
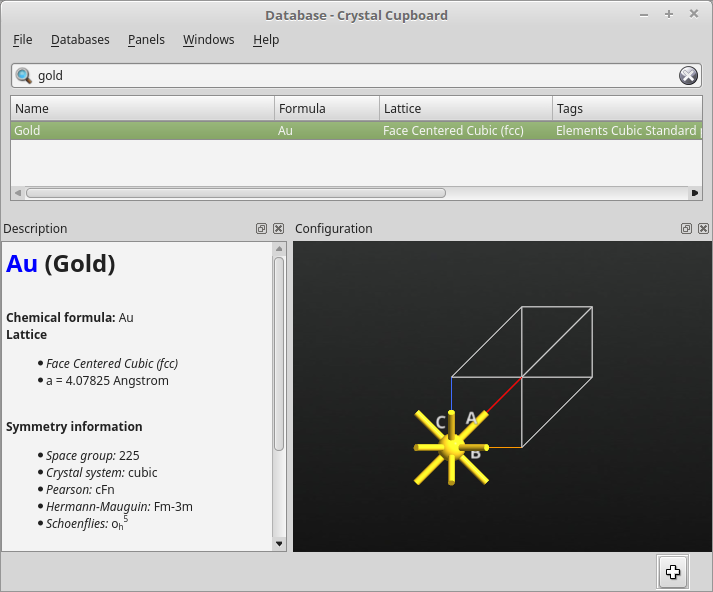
It is of course not necessary to always build structures from scratch. Instead, you can import configurations from the  Database:
Go to the Stash and select .
From the menu click and search for “Water” in the search window.
Select “Water” and add it to Stash by double-clicking it or by using the
 icon.
icon.
Calculating the LUMO state
In the Builder, click
 in the lower right-hand corner, and select Script Generator.
In the
 Scripter, add the following blocks by double-clicking the correspoding icons in the Blocks panel on the left-hand side of the screen:
 New Calculator.
 .
.- .


Go to Global IO and define a suitable location and name of the HDF5 file in which your results will be saved, using the
 button. In this tutorial, save this file as
 Water_LUMO.hdf5: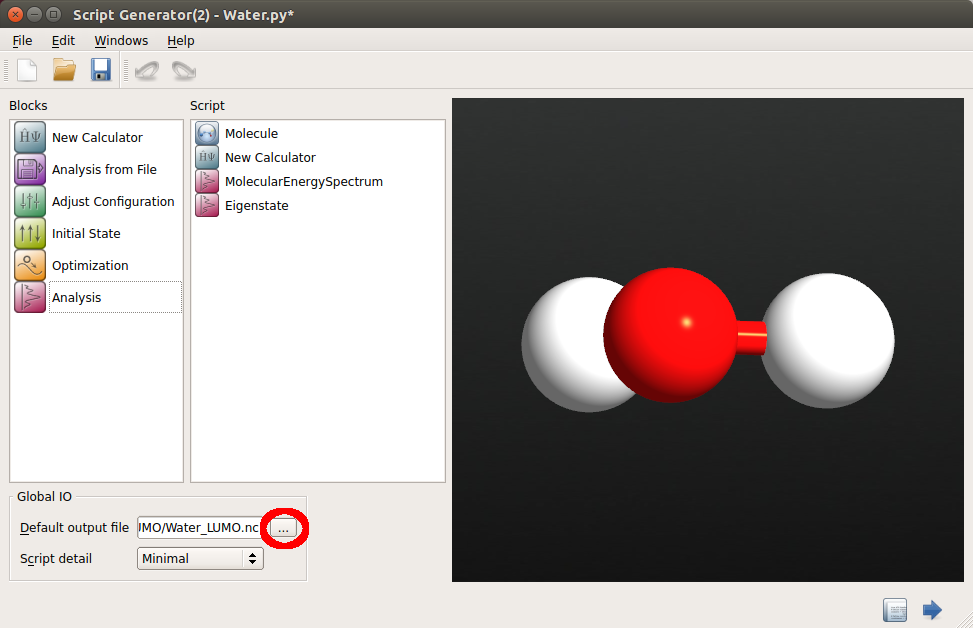
Now double-click the
Eigenstate block and edit it:Since water has 8 valence electrons (one for each hydrogen and six for oxygen; the two 1s electrons are part of the pseudocore in QuantumATK), there will be 4 occupied states, each one doubly degenerate since this is a spin-independent calculation. Therefore set the quantum number to 4 for the LUMO state.

To run the calculation, use the
Send to button to send the script to the  Job Manager.
Then, save the script using the window that appears.
Job Manager.
Then, save the script using the window that appears.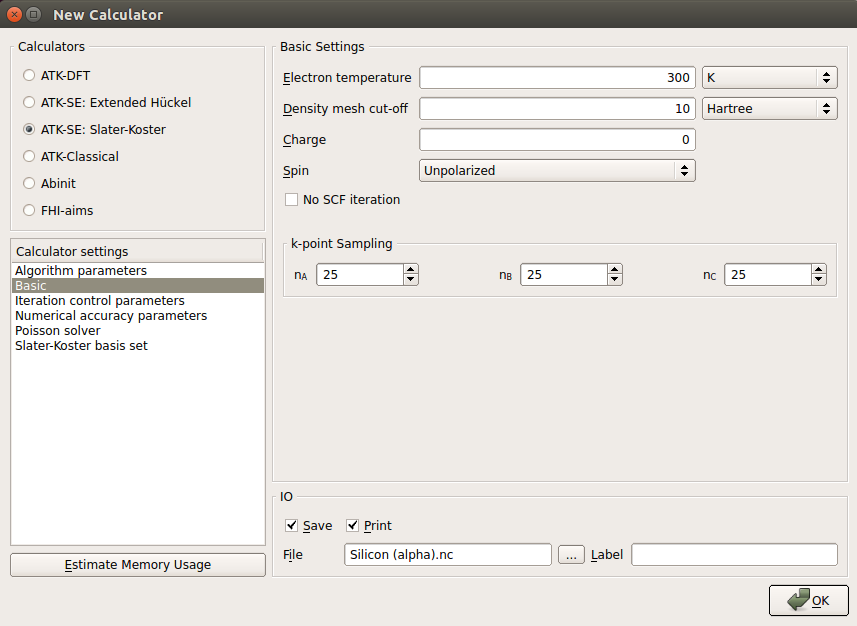
When the Job Manager opens up, click on the
 button to run the script.
When the script has finished (it takes a minute or so), navigate to the LabFloor in the QuantumATK main window and click on the
 tab of the HDF5 file in order to display the objects contained there.
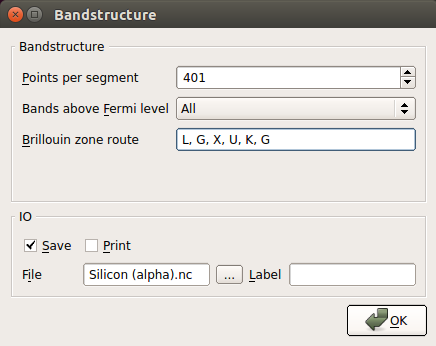
Select both the Eigenstate and MolecularConfiguration objects stored in the HDF5 file (use a left mouse click while holding down
Ctrl), and drag and drop both objects onto the Viewer, which will then pop up.

Click OK, and click OK again in the next window.
In the Viewer, click on Properties.

To obtain the same image as below, do as follows:
Go to and uncheck “Compass enabled”.
Go to and set the Isovalue to 0.087.
Go to and set the Rendering style to Lines.
Go to and set the atoms and bonds radious to 0.25 and 0.05, respectively.

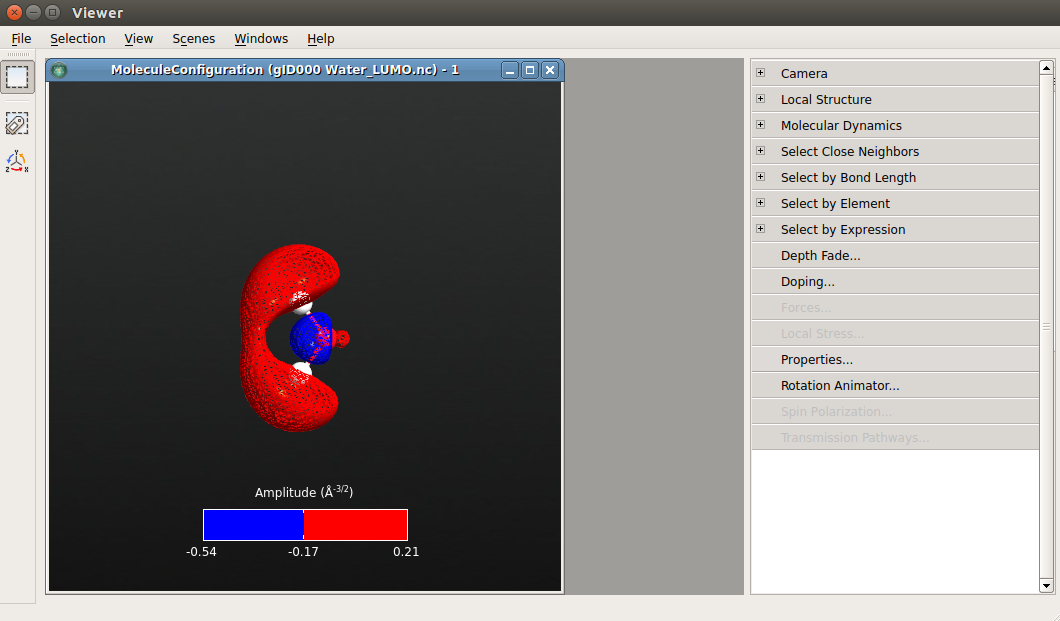
Attention
Please note the use of the “\(\pm\)isovalue” option. When checked, it divides the full range of available isovalues into two equally large ranges, and plots the two ranges in complimentary colors.