Calculate the band structure of a crystal
In this tutorial, you will learn how to calculate the band structure of silicon by using the extended Hückel method.
Start QuantumATK and create a new project
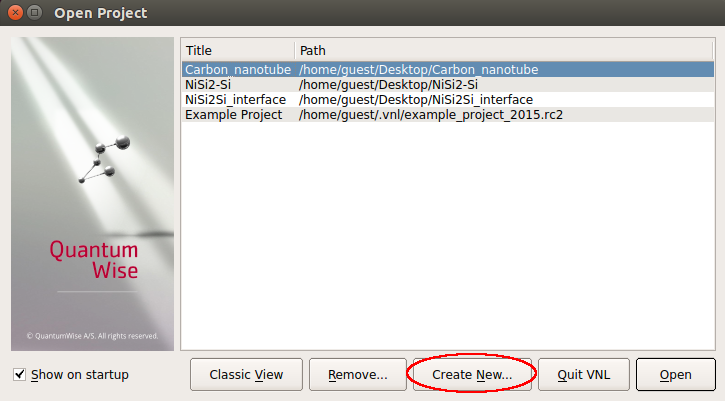
Open QuantumATK and create a new project by clicking Create New. Give the project a Title (here: “Silicon_band_structure”), select the folder where data will be stored, then click OK and Open to start the project.

Import the Silicon structure from the Database and send it to the Scripter
In the QuantumATK main window, click on the
 icon to open the Builder.
Go to the Stash, click , and choose from the menu. Type “Silicon” in the filter field at the top and select “Silicon (alpha)” in the list. Click the
 icon, or double-click its line in the list, to send it to the Stash.
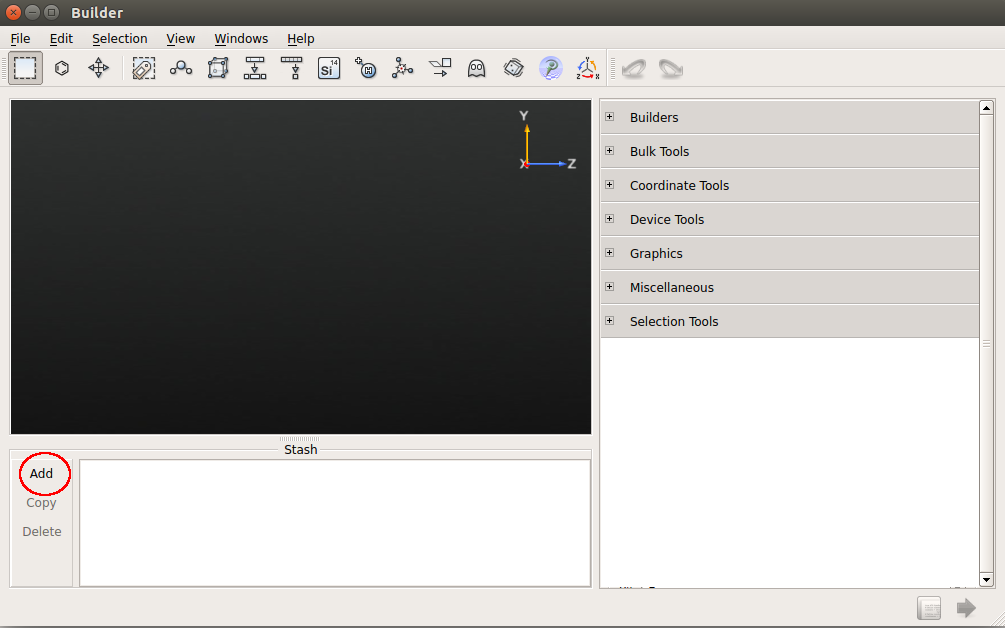

Send the bulk structure to the
 Scripter. In order to do that, click the
  button and choose Script Generator from the menu that appears.
Set up the calculation and analyse the band structure
In the Script Generator, use double-clicks to add a
 New Calculator block.
Also add one
 block.
Change the default name of the HDF5 file in the Global IO options: Type in
Si_band_structure.hdf5.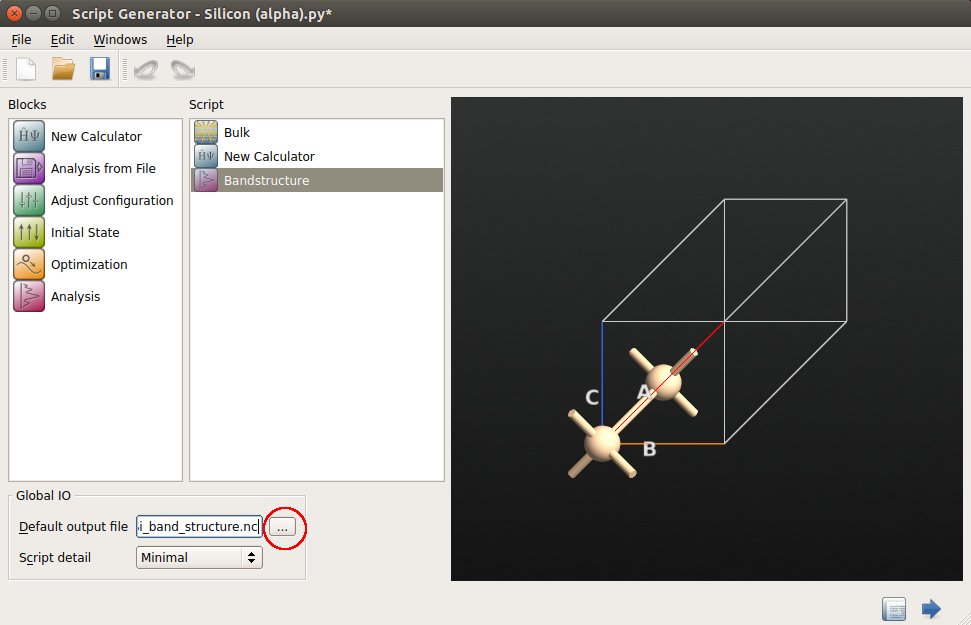
Double-click the
New Calculator block to define the parameters for the quantum-chemical method:Set the calculator to “Extended Hückel” (or leave it at DFT if you so prefer), and specify a k-point sampling of nA = nB = nC = 13.

If you use the Extended Hückel, you must also change the basis set to Cerda.Silicon to get a proper description of the band gap.
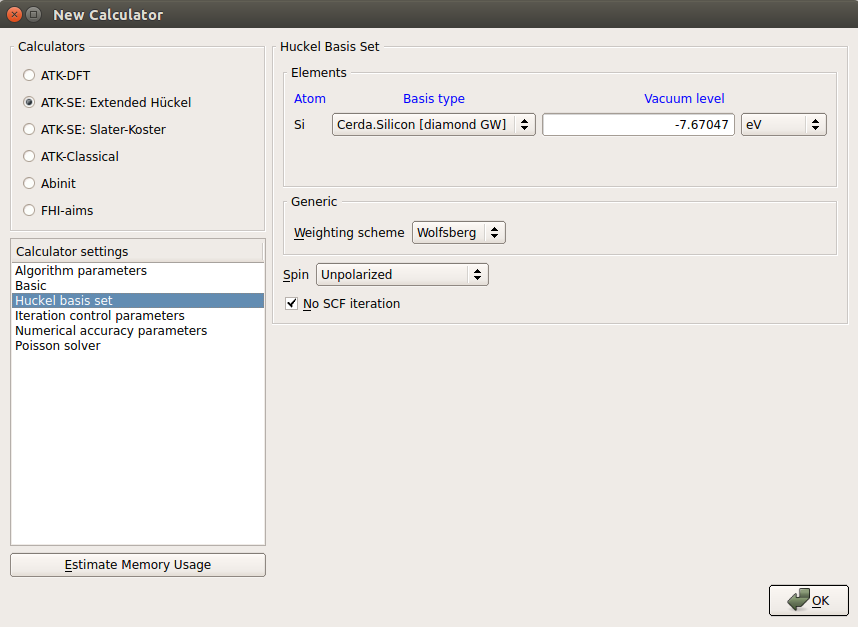
Click OK to save the changes.
Now open the Bandstructure block. We will not change anything, but you can see how the path in the face-centered cubic Brillouin zone between the symmetry points G, X, W, L, G, K, X, U, W, K, L, is set up. Click OK.

If you are interested in inspecting the actual Python script, you can now send the scipt to the
 Editor: Use the button or simply drag and drop it onto . Note that this will minimize the Script Generator window.
In order to run the script, you simply send it to the
 Job Manager, again using the button.
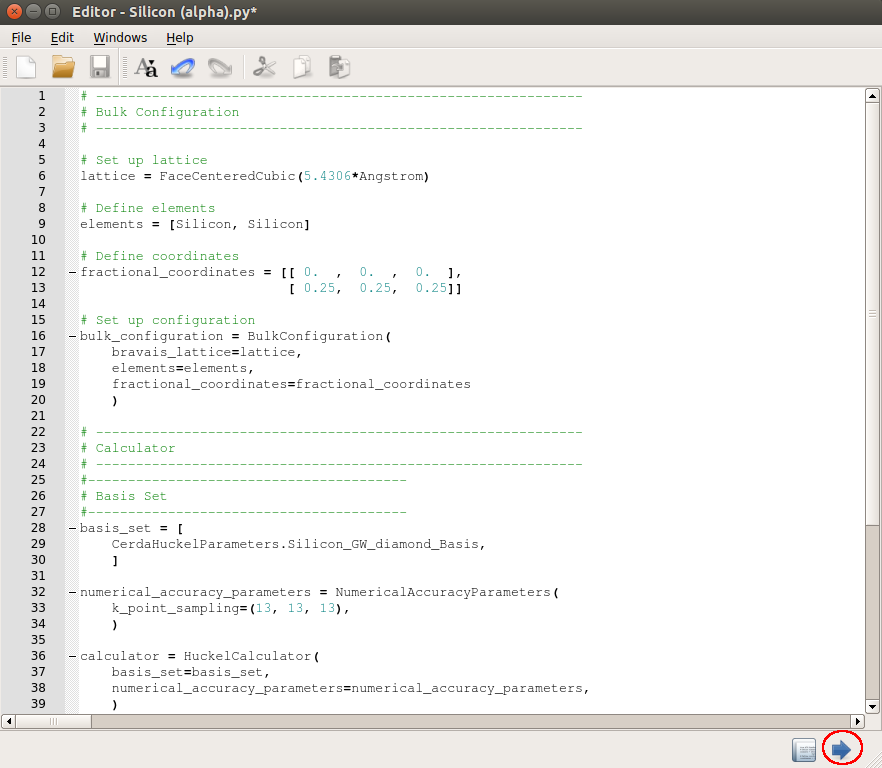
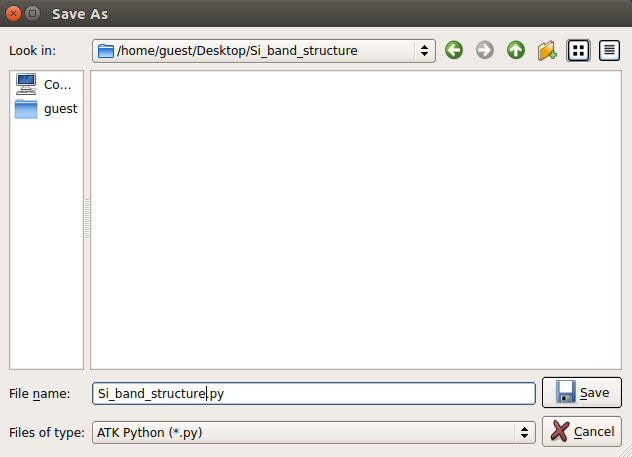
Save the script in the window that appears.
In the Job Manager, click
 to run the script.
When the script has finished (it should only take a few seconds), go back to the main QuantumATK window, and click the tab (
 ) next to your HDF5 file,
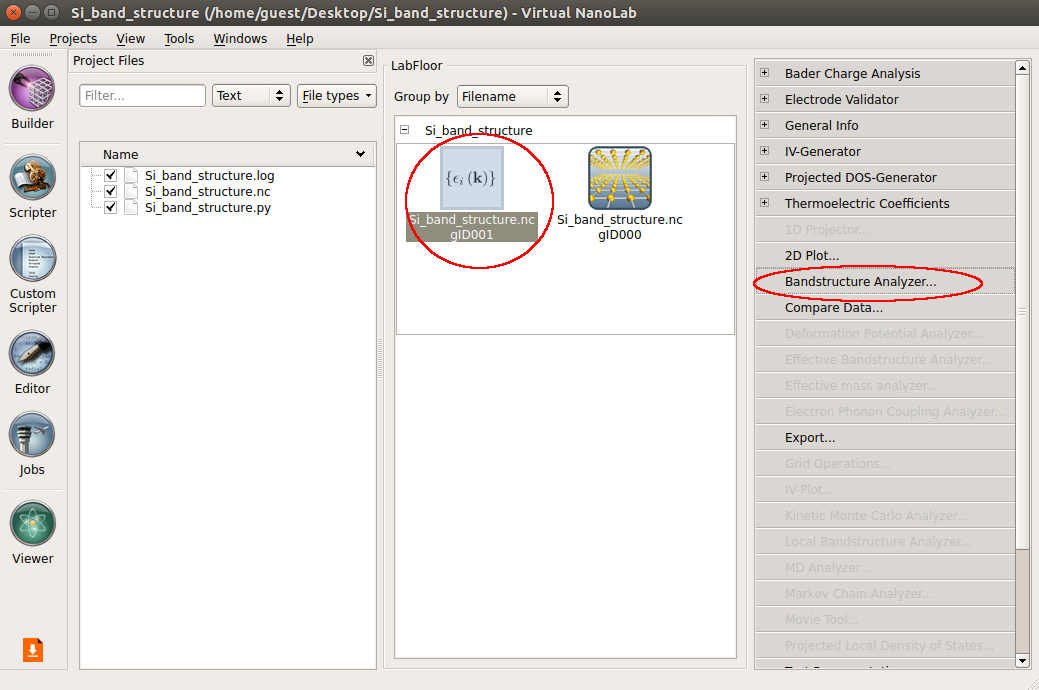
 Si_band_structure.hdf5, to see the objects contained in it.
Select the Bandstructure object and plot it with the Bandstructure Analyzer in the right-hand plugins panel.
In the band structure plot that opens, you can zoom in using the
 Zoom to rectangle tool. You can also save the figure by clicking the
  button.