GridData
Included in QATK.Analysis
- class GridData(values, axes, display=None)
GridData contains a grid of arbitrary data spanned over a number of axes.
The simplest case is a one-dimensional grid data of scalar quantities:
GridData(values=[1, 2, 3, 4], axes=[0.1, 0.2, 0.3, 0.4])
It also supports PhysicalQuantity as data and it can handle multiple dimensions:
GridData(
    values=[[1, 2, 3], [4, 5, 6]] * eV,
    axes=[
        [0.1, 0.2] * Angstrom,
        [0.4, 0.5, 0.6] * Degrees
    ]
)
The values and the axes can also be given names to easily distinguish them:
GridData(
    values=('Energy', [[1, 2, 3], [4, 5, 6]] * eV),
    axes=[
        ('Distance', [0.1, 0.2] * Angstrom),
        ('Angles', [0.4, 0.5, 0.6] * Degrees)
    ]
)
The names can be used for visualization as well as grid operations, see the
grid()method for additional information.A default visualization for the grid data can be specified through the optional display option, see the
setDisplay()method.- Parameters:
values (sequence of named values) – The (optionally named) grid values at each data point.
axes (sequence of named axes) – The (optionally named) axes.
display (dict) – Optional default
displayoptions.
- axes()
The grid axes.
- Returns:
The grid axes.
- Return type:
tuple of PhysicalQuantity
- axesNames()
The axes names.
- Returns:
The axes names.
- Return type:
tuple of str
- axis(name=None)
Retrieve the named axis.
- Parameters:
name (str | NoneType) – The name of the axis to retrieve.
- Returns:
The named axis.
- Return type:
- display()
The default display option.
- Returns:
The default display options.
- Return type:
dict | NoneType
- classmethod fromPoints(values, points, display=None)
Create GridData from points.
- Parameters:
values (sequence of values) – The values.
points (sequence of sequence of axis values) – The points.
display (NoneType | dict) – The optional default display options.
- Returns:
The created GridData.
- Return type:
- classmethod fromSequence(values, axes, display=None)
Create GridData from sequences of values by using the axes to reshape it.
- Parameters:
values (sequence of named values) – The (optionally named) grid values at each data point.
axes (sequence of named axes) – The (optionally named) axes.
display (NoneType | dict) – The optional default display options.
- Returns:
The created GridData.
- Return type:
- grid(names=None, averages=None, sums=None)
Create a reduced grid by performing averages or sums along several axes.
Averaging over an axis named
Anglecan then be done by calling:averaged_data = data.grid(averages=('Angle'))
Or similarly, summing over the axes
DistanceandAngle:summed_data = data.grid(sums=('Distance', 'Angle'))
- Parameters:
names (tuple of str) – The named values to include.
averages (tuple of str) – The names of axes to average over.
sums (tuple of str) – The names of axes to sum over.
- Returns:
The reduced grid.
- Return type:
- names()
The names of the values.
- Returns:
The names of the values.
- Return type:
tuple of str
- nlinfo()
- Returns:
Structured information about the GridData.
- Return type:
dict
- nlprint(stream)
Print a string containing an ASCII description of the GridData.
- Parameters:
stream (file-like) – The stream to write to. This should be an object that supports strings being written to it using a
writemethod.
- setDisplay(value=None, x=None, y=None, averages=None, sums=None)
Set the default display options.
In case of a grid with two axes, the display could be a line, averaged over one of them:
data.setDisplay(x='NameAxis1', averages=('NameAxis2'))
See the
grid()method for additional information.- Parameters:
value (str) – The name of the value to display.
x (str) – The name of the axis to consider as x axis.
y (str) – The name of the axis to consider as y axis.
averages (tuple of str) – The names of the axes to average over.
sums (tuple of str) – The names of the axes to sum over.
- uniqueString()
Return a unique string representing the state of the object.
- value(name=None)
Retrieve the named value.
- Parameters:
name (str | NoneType) – The name of the value to retrieve.
- Returns:
The named value.
- Return type:
- values()
The values.
- Returns:
The values.
- Return type:
tuple of PhysicalQuantity
Usage Examples
Here is a short overview over the different ways to use the GridData class. The simplest case is a one-dimensional grid data:
GridData(values=[1, 2, 3, 4], axes=[0.1, 0.2, 0.3, 0.4])
It also supports PhysicalQuantity and the fromSequence() constructor can reshape the values array automatically based on the provided axes:
GridData.fromSequence(
    values=[1, 2, 3, 4, 5, 6],
    axes=[
        [0.1, 0.2] * Angstrom,
        [0.4, 0.5, 0.6] * Degrees
    ]
)
The grid can scale up to multiple values and dimension, names can be used to easily identify each of them:
GridData(
    values=[
        ('Energy', [[1, 2, 3], [4, 5, 6]] * eV),
        ('Temperature', [[200, 300, 400], [250, 350, 450]] * Kelvin)
    ],
    axes=[
        ('Distance', [0.1, 0.2] * Angstrom),
        ('Angle', [0.4, 0.5, 0.6] * Degrees)
    ]
)
The names can be used for visualization as well as grid operations. Averaging over all angles can then be done by calling:
averaged_data = data.grid(averages=('Angle'))
Or similarly, summing over all distances,
summed_data = data.grid(sums=('Distance'))
Quick example - Total energy of diatomic molecules
In the following ATKPython example script, we compute the total energy of several diatomic molecules, for different atomic numbers and bond lengths. They can then be saved as values on a two-dimensional grid.
atomic_numbers_dict = {
    Hydrogen: 1,
    Nitrogen: 7,
    Oxygen: 8,
    Fluorine: 9,
    Chlorine: 17
}

bond_lenghts = [0.6, 0.8, 1.0, 1.2, 1.4, 1.6, 1.8, 2.0]

total_energies = []
atomic_numbers = []

for element in atomic_numbers_dict:
    molecule = MoleculeConfiguration(
        elements=[element, element],
        cartesian_coordinates=[[0, 0, 0], [1, 0, 0]] * Angstrom,
        padding_length=5 * Angstrom
    )
    molecule.setCalculator(LCAOCalculator())
    atomic_numbers.append(atomic_numbers_dict[element])

    for bond_lenght in bond_lenghts:
        molecule.setCartesianCoordinates(
            [[bond_lenght, 0, 0]] * Angstrom,
            indices=[1]
        )
        total_energy = TotalEnergy(molecule)
        total_energies.append(total_energy.evaluate())

grid = GridData.fromSequence(
        values=('Total energy', total_energies),
        axes=[
            ('Atomic number', atomic_numbers),
            ('Bond lenght', bond_lenghts),
        ]
    )
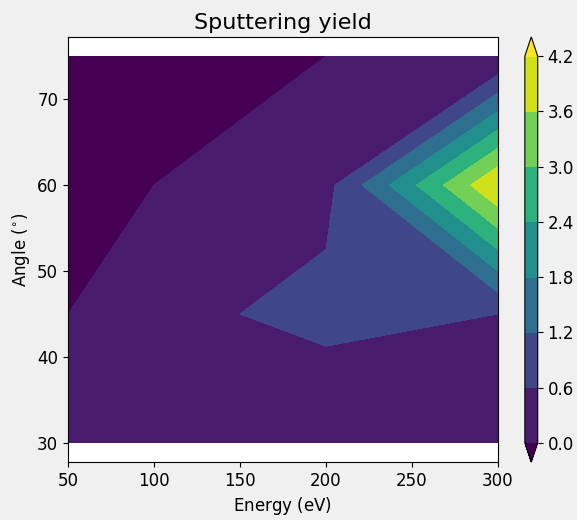
Realistic example - Sputtering yield of a surface process
A more realistic example could be a study of the sputtering yield using SurfaceProcessSimulation. However this script will take significantly longer to execute, compared to the previous one. Also, the purpose of these scripts is only to document the GridData class, not to show solutions to real case studies.
This script simulates the shooting of an argon atom to a silicon surface, with different kinetic energies and incident angles; finally, it repeats each event 5 times. The following code snippet contains the section of the script that creates the GridData object, the entire script is available for download below.
sputtering_yield = [item.sputteringYield() for item in iteration_items]

grid_data = GridData.fromSequence(
    values=(
        ('Sputtering yield', sputtering_yield)
    ),
    axes=(
        ('Energy', energies),
        ('Angle', angles),
        ('Repeat', repeats)
    ),
    display={
        'x': 'Energy',
        'y': 'Angle',
        'averages': ('Repeat',)
    }
)
The sputtering yield is saved on a grid, with the incident angles and energies on two of the axes, the last axis is defined by the repeats and is averaged over by the default display option. The data can be visualized with a contour plot.