Getting Familiar with QuantumATK
There are two different ways to start up QuantumATK:
by clicking the QuantumATK icon on the Desktop;
by executing the
quantumatkcommand in a terminal.
When doing one of these, the Open Project window will appear. It allows you to manage projects and open one of them. Each project must be given a suitable title and a local path for storing project files. Use the Create New button to add a new project (see next chapter).

Once you have selected a project and clicked Open, the QuantumATK main window will show up. The following sections will introduce the main parts of QuantumATK and the functionalities each part offers.
QuantumATK Main Window
The figures below illustrate how the QuantumATK main window may be divided into 5 main sections.
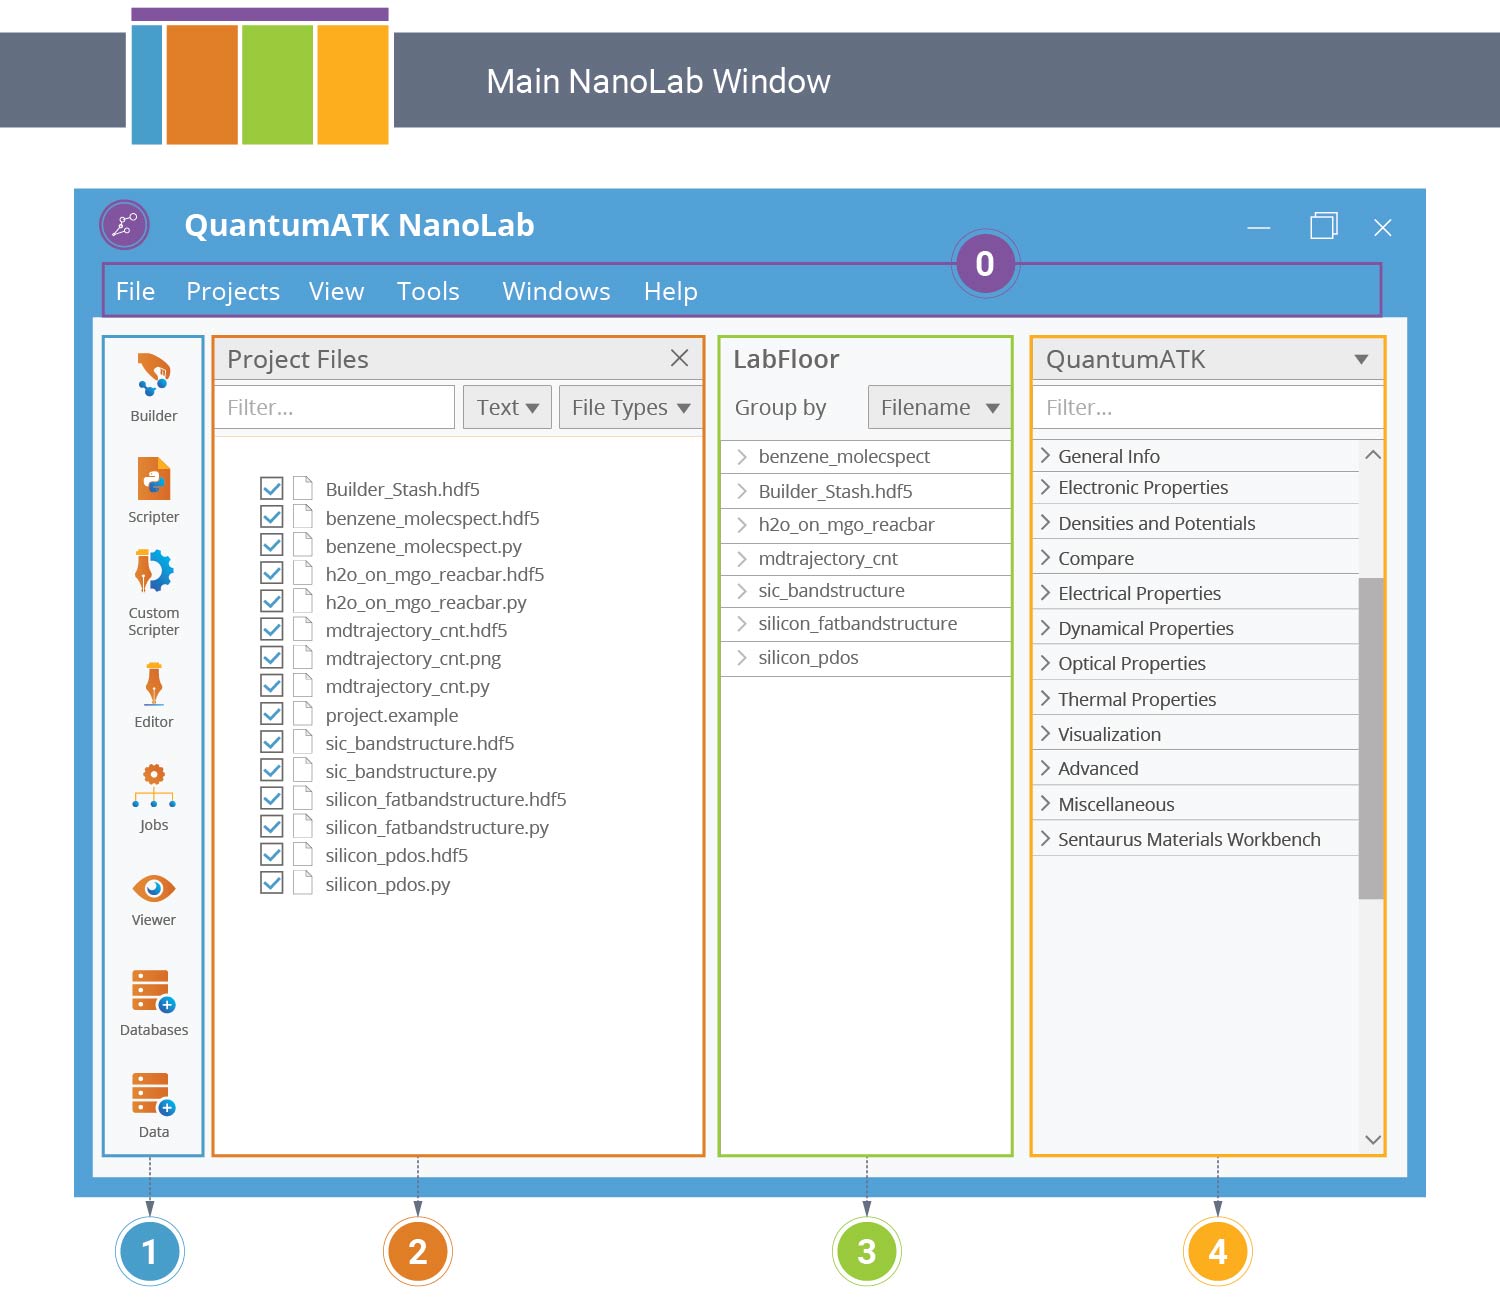
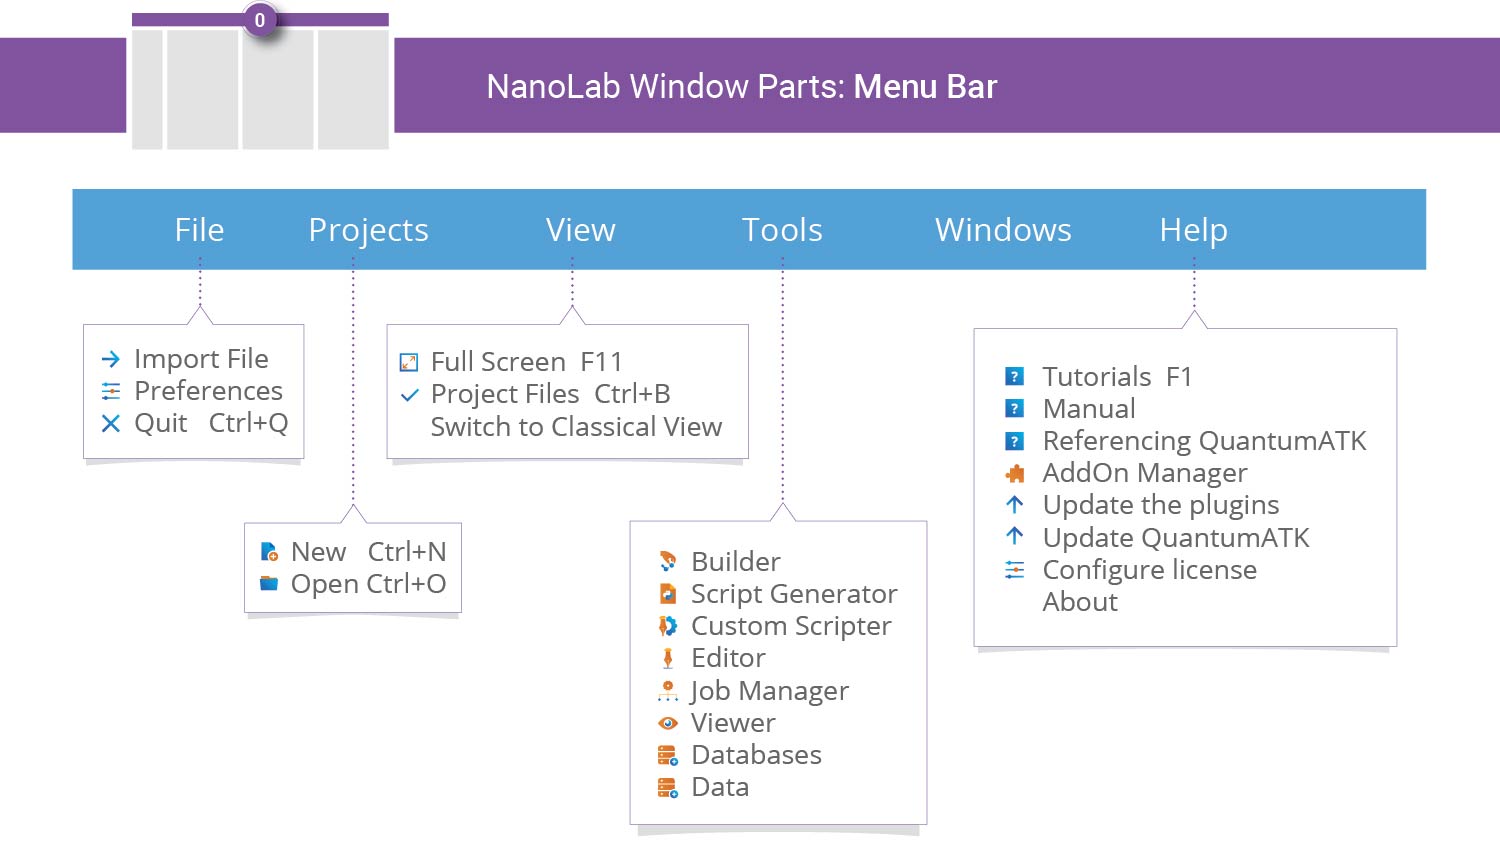
Menu Bar
The Menu Bar is the horizontal bar located at the top of the main window. Use it for example to import files, open new projects and quit the program. The bar also allows you to open the Preferences, About QuantumATK, and AddOns Manager widgets.
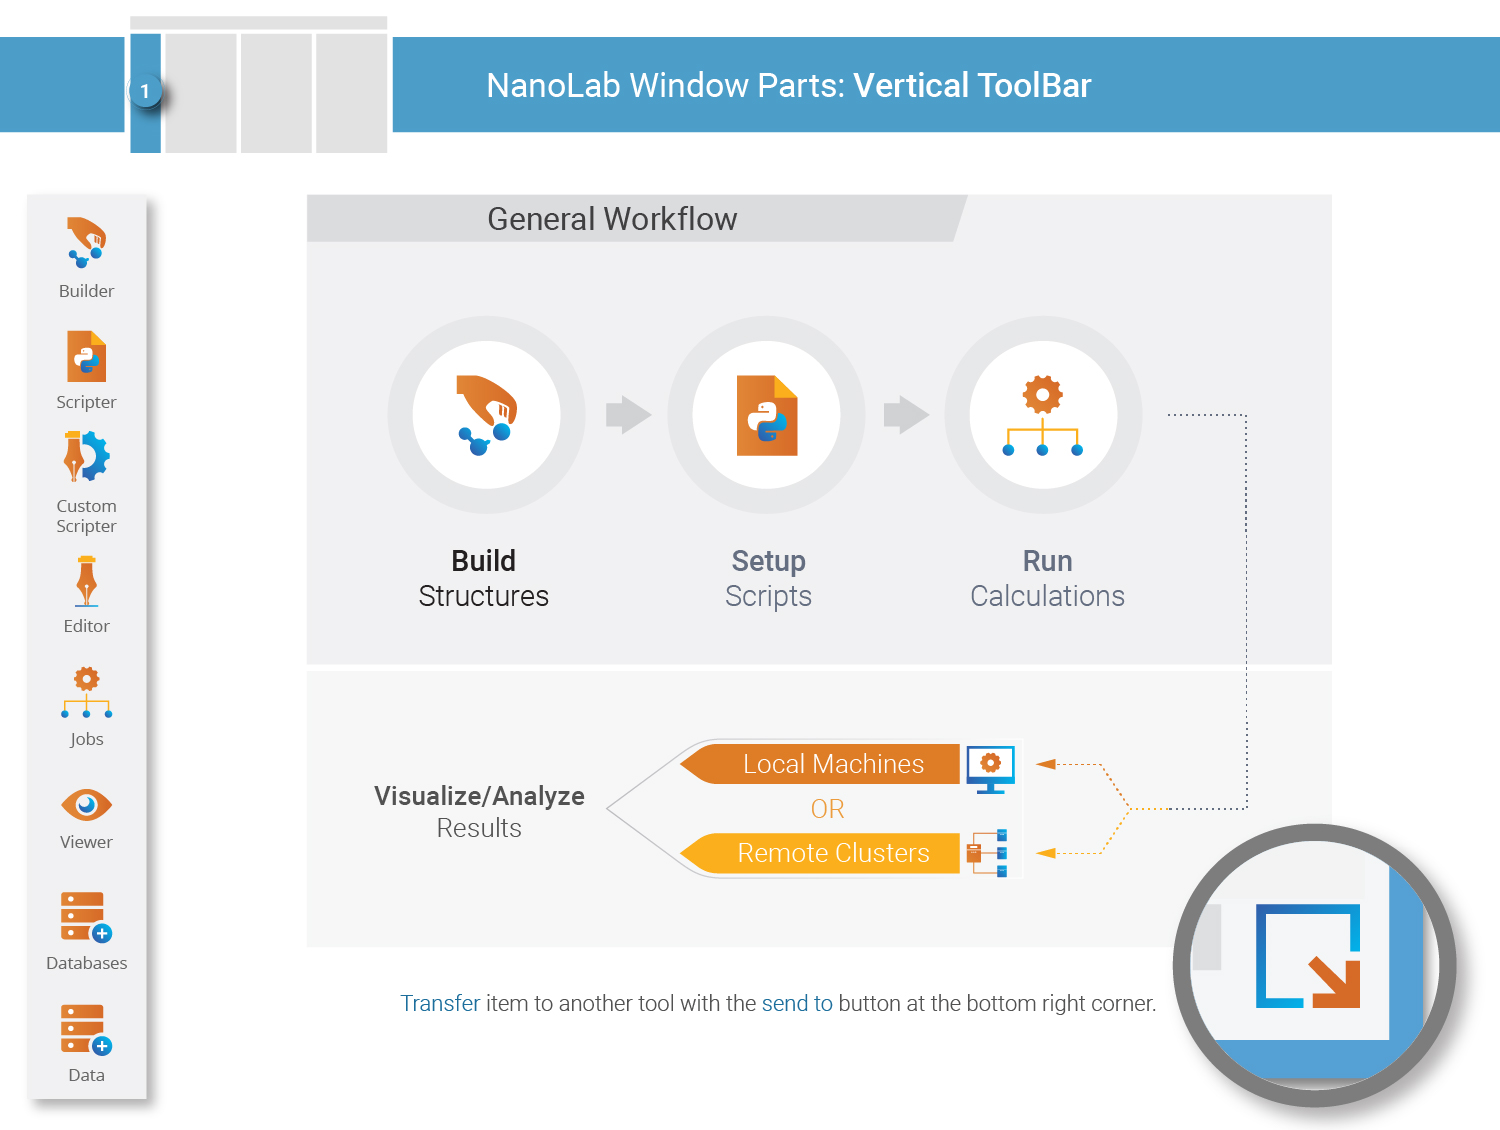
Vertical ToolBar
The combination of QuantumATK, and Python scripting is extremely flexible, and makes it possible to do your everyday atomistic modeling in a variety of different ways. However, the design of QuantumATK encourages in particular one simple and intuitive workflow:
 Create atomistic structure.
 Set up calculations.
 Run job.
 Analyze results.
Building Atomistic Structures
The Builder is a graphical interface for building any
desired nanoscale structure. The Stash contains the configurations
you have built in the current project, and an ever expanding list of tools
and plugins can be used to manipulate the structures.

A Stash item must be active in order to apply an operation by one of the Builder tools.

Once an item is activated, it is visualized in the 3D View. You can also apply operations on a Stash item such as rename, copy, and delete.
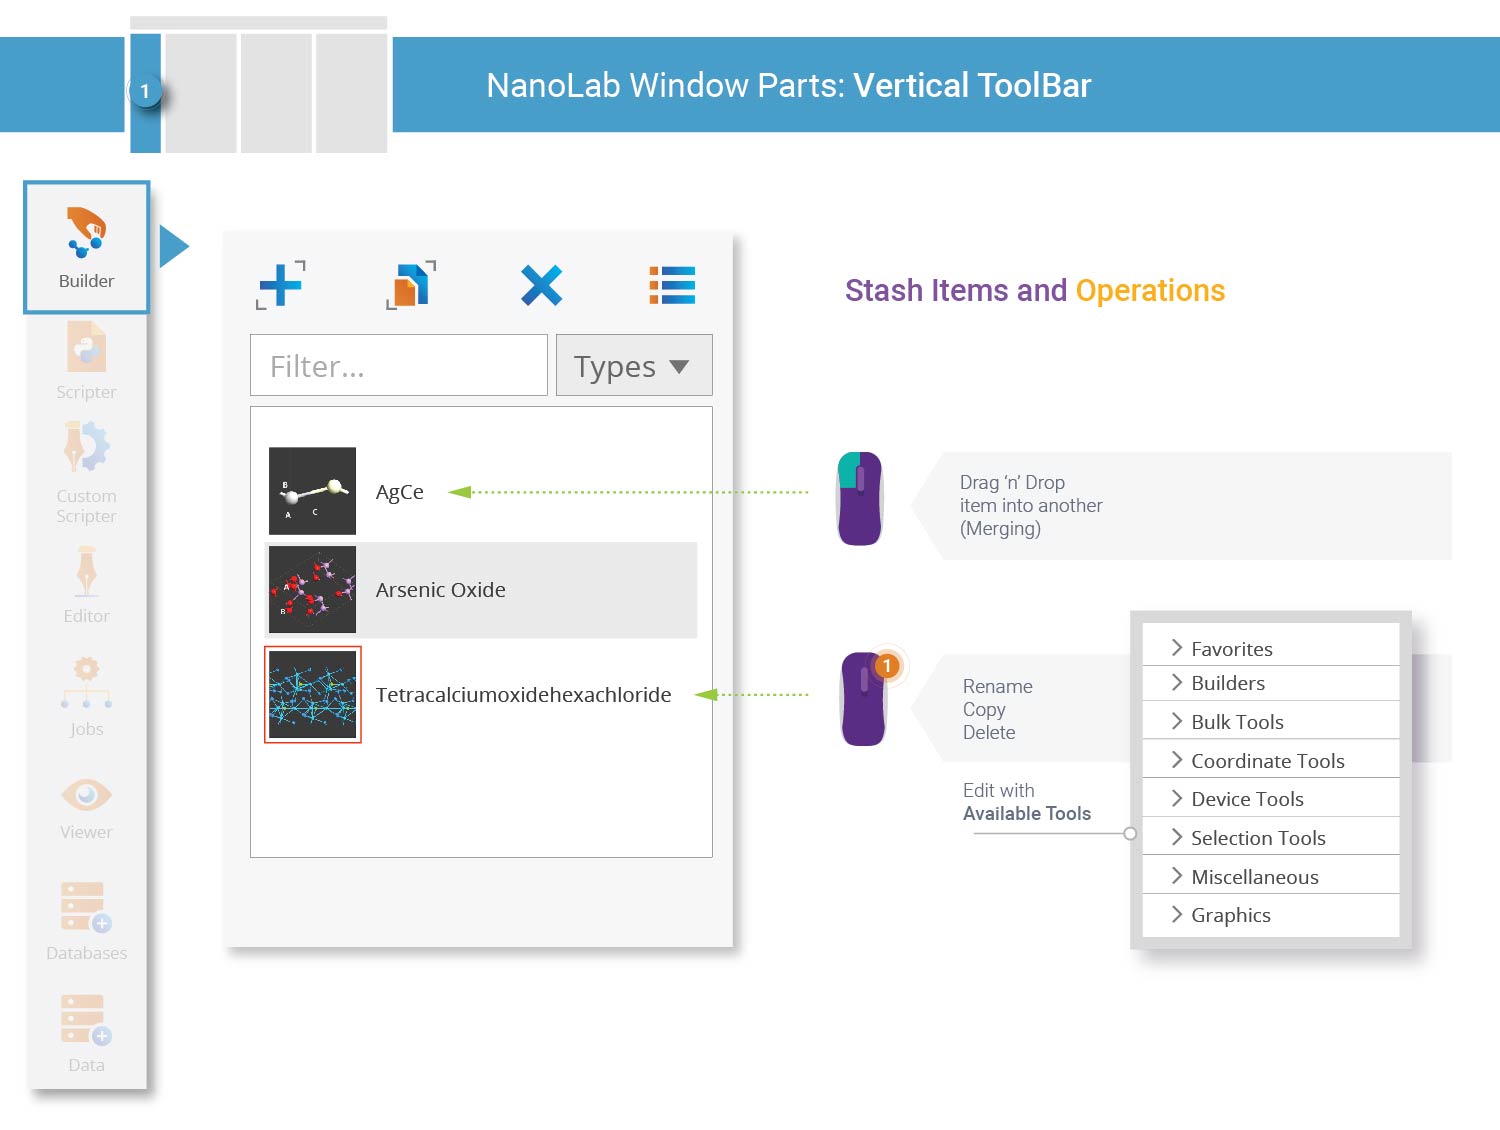
When you have finished building your configuration, use the  Send to button (located in the lower-right corner of the Builder window)
to transfer it to the Script Generator and set up the desired calculations.
This is the topic of the next section.
Send to button (located in the lower-right corner of the Builder window)
to transfer it to the Script Generator and set up the desired calculations.
This is the topic of the next section.
Script Generator
ATK is executed using Python scripting, and the
Script Generator is a graphical interface for generating QuantumATK Python
scripts – it allows you to graphically add blocks of Python code to the
script and edit relevant settings if needed.
Simply double-clik a block in the left-hand panel (named Blocks) to add it to the Script in the right-hand panel. The order of the blocks, from top to bottom, defines the workflow of the QuantumATK calculation.

All data from the QuantumATK calculation is saved in the Default output file.
It should have file extension .hdf5.
Note
HDF5 is a data model, library, and file format for storing and managing data. It supports an unlimited variety of datatypes, and is designed for flexible and efficient I/O and for high volume and complex data. HDF5 is portable and is extensible, allowing applications to evolve in their use of HDF5. The HDF5 Technology suite includes tools and applications for managing, manipulating, viewing, and analyzing data in the HDF5 format.
Once you have finished setting up the QuantumATK Python script, you can save it
with file extension .py and then execute it on a supercomputing
cluster or in a terminal on your local machine:
atkpython example.py > example.log
Alternatively, you can click the button and transfer the script
directly to the Job Manager for local or remote execution, see next section.
Job Manager
The Job Manager is a graphical interface for executing
calculations, both on your local machine and on any remote computing
cluster(s) that you have access to.
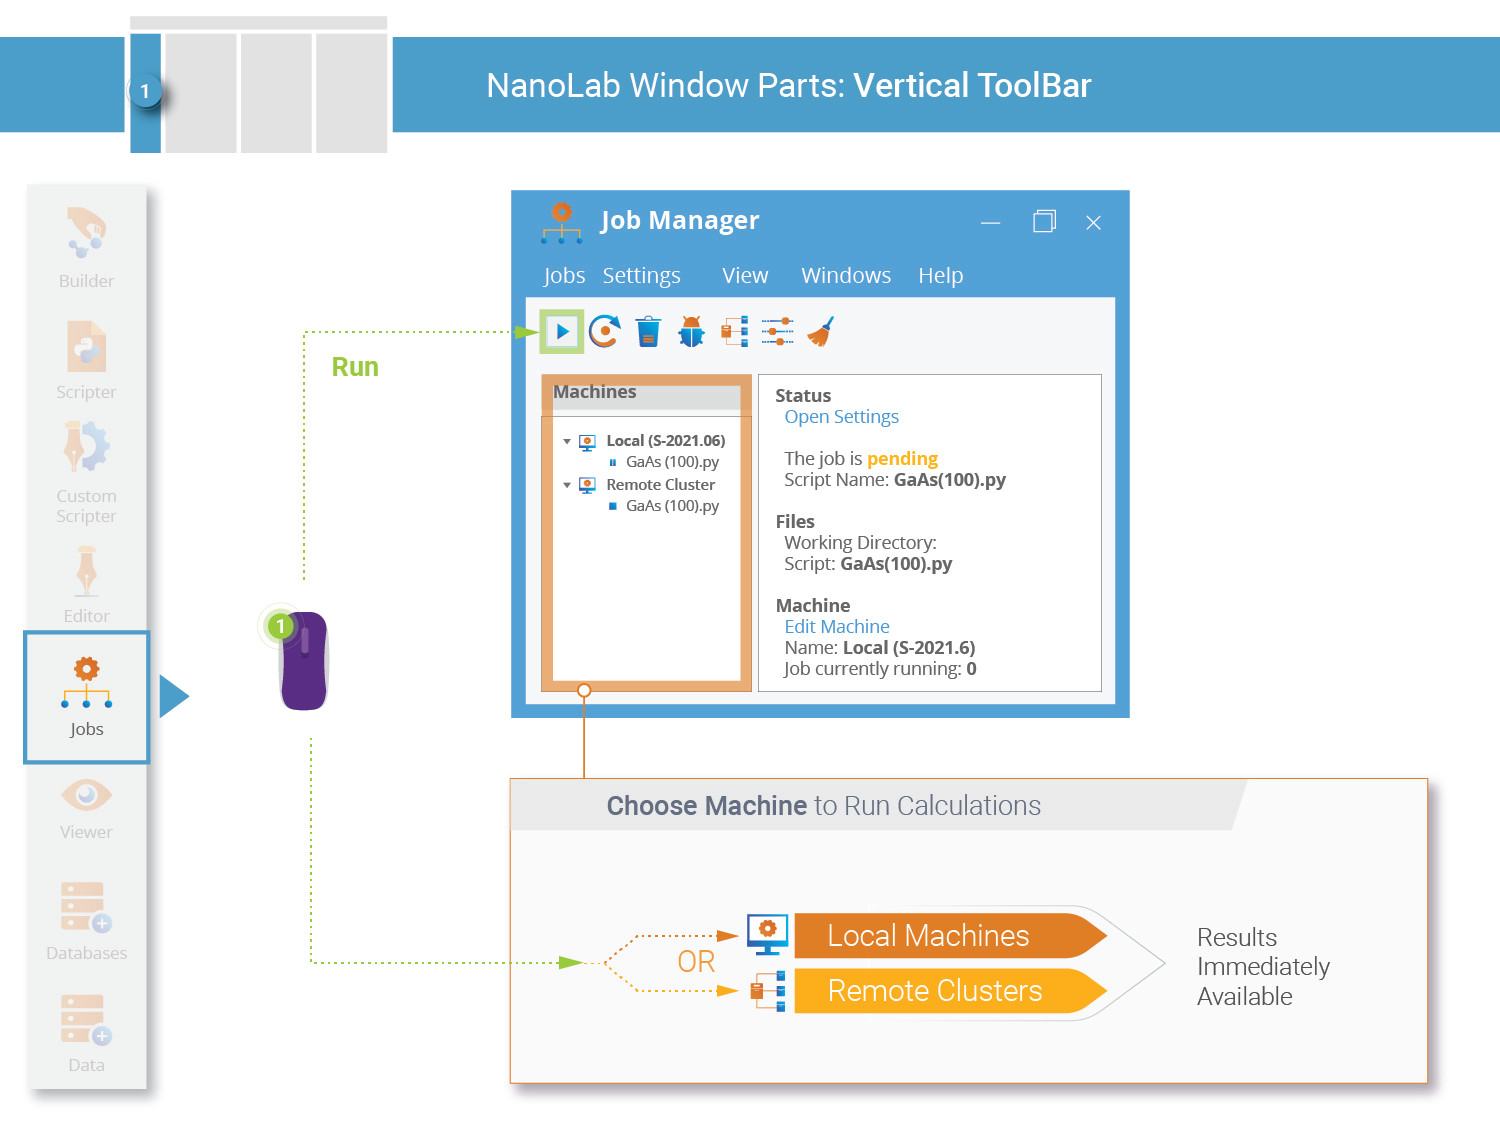
Once a calculation has finished, the HDF5 data file with results should appear in the Projects Files panel in the QuantumATK main window.
Note
The Job Manager allows for parallel execution with MPI and/or threading, see the tutorials Job Manager for local execution of QuantumATK scripts and Job Manager for remote execution of QuantumATK scripts for more information.
Analyzing the Results
Data analysis and visualization is the final step in the most basic QuantumATK workflow: You have built a nanostructure, calculated the electronic structure at some level of theory, and have most likely performed some post-SCF analysis, e.g. computed the electron density and band structure. It is time to visualize the results and perhaps perform further analysis.
The Project Files panel shows at all times the contents of the project
folder you specified when creating the project (unless filtering is used).
This includes QuantumATK scripts (.py), QuantumATK data files (.hdf5), log
files, images, and any other standard file type.
Next, the LabFloor shows the contents of the selected (ticked) .hdf5
data files. QuantumATK reads the data as individual Python objects, and displays
each object as an easily recognizable item on the LabFloor. In the figure
below, the data file GaAs(100).hdf5 contains three saved data items:
The band structure, the bulk configuration, and the electron density.
Finally, the Panel Bar offers an extensive list of analysis and visualization tools that can be applied to the selected LabFloor item(s). This way, the LabFloor and Panel Bar constitute in total a graphical interface for analyzing and visualizing the data generated by running simulations.

Note
The LabFloor will show all the objects saved in a .hdf5 data
file, and the contents of newly generated files are automatically added
to the LabFloor. Ticking/unticking a file in the Project Files list
adds/removes its contents from the LabFloor.
A LabFloor item must be selected in order to apply an analysis tool to it.
Panel Bar tools that cannot be applied to a selected item type are greyed out.
The Viewer is one possible analysis tool – it is used to
visualize configurations as well as grid quantities (e.g. electron density).
