MDMeasurement
Included in QATK.Dynamics
- class MDMeasurement(measurements, call_interval=None)
A measurement hook used to save common MD scalar quantities. Should be used as measurement_hook in MolecularDynamics.
- Parameters:
measurements (list of type str) –
A list of measurements to save. Valid measurement names include:
kinetic_energy
potential_energy
volume
density
temperature
pressure
stress
strain
dipole
charge_current
charge_current_components
The measurements, “pressure”, “stress”, and “strain” represent the average of the diagonal components of these tensors. Individual tensor components can be obtained by appending an underscore and two Cartesian directions. For example, the pressure along the xy direction is represented with “pressure_xy” and the strain along the x direction is “strain_xx”. If the full tensor is desired, then “_tensor” can be appended. For example “strain_tensor” or “pressure_tensor”. The same applies for vectors, with components referenced by x, y and z. The complete vector is referenced by the postfix “_vector”
call_interval (int) – The interval at which the hook function’s call method should be invoked during an MD simulation. Default: 1 (called at every step).
- callInterval()
- Returns:
The call interval of this hook function.
- Return type:
int
- measurementNames()
- Returns:
The names of all measured properties.
- Type:
list of type str
- measurements()
- Returns:
The measurements.
- Return type:
list of str
- uniqueString()
Return a unique string representing the state of the object.
Usage Examples
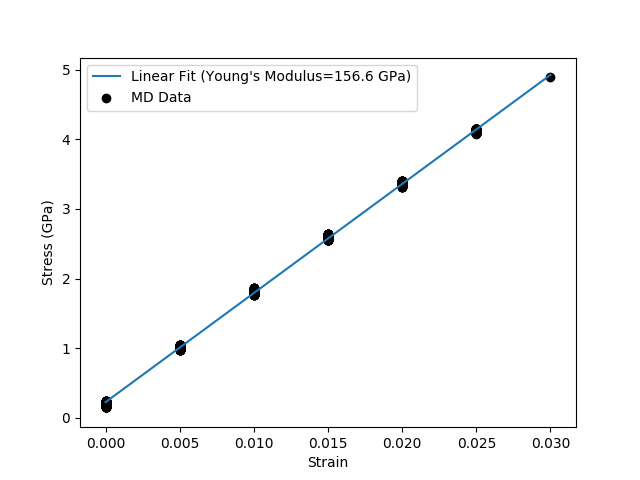
Run a 6 ps NVT MD simulation, with a strain rate of 0.25% per ps, while measuring the stress and strain at every MD step. These measurements are then used to plot a stress-strain curve.
# Define a strain configuration hook.
strain_hook = StrainConfigurationHook(
    strain_direction='x',
    strain_rate=0.005 / ps,
    strain_interval=1000,
)

measurement_names = ['stress_xx', 'strain_xx']

md_trajectory = MolecularDynamics(
    bulk_configuration,
    constraints=constraints,
    trajectory_filename='stress_strain.hdf5',
    steps=6000,
    log_interval=1000,
    pre_step_hook=strain_hook,
    measurement_hook=MDMeasurement(measurement_names, call_interval=1),
    method=method,
)

bulk_configuration = md_trajectory.lastImage()

# Get stress strain values.
times, strains = md_trajectory.measurement('strain_xx')
times, stresses = md_trajectory.measurement('stress_xx')

# Perform linear fit.
polynomial_coefficients = numpy.polyfit(strains, stresses.inUnitsOf(GPa), 1)
youngs_modulus = polynomial_coefficients[0] * GPa

# Evaluate polynomial to plot best fit line.
stresses_fit = numpy.polyval(polynomial_coefficients, strains)

# Plot the fit.
import pylab
pylab.plot(
    strains,
    stresses_fit,
    label="Linear Fit (Young's Modulus=%.1f GPa)" % youngs_modulus,
)

# Plot MD data.
pylab.scatter(
    strains,
    stresses.inUnitsOf(GPa),
    label='MD Data',
    color='k',
)

# Setup plot.
pylab.xlabel('Strain')
pylab.ylabel('Stress (GPa)')
pylab.legend()

# Save to file.
pylab.savefig('stress_strain.png')
The resulting plot will look like:
The full script can be downloaded: stress_strain.py
Notes
All measurements are stored on the MDTrajectory object and can be accessed using the
measurementmethod. This method returns a tuple of the MD times associated with the measurement and the measurements itself.Custom measurements can be defined using the
measurement_hookargument of MolecularDynamics. For additional details see MolecularDynamics notes.Measurements can be visualized using the MovieTool with the MDTrajectory.
When a MDTrajectory is read on the LabFloor all measurements will be displayed. Custom plots can be created using the Data Plot plugin.