Atomic Layer Etching: Cl2 Adsorption and Ar Ion Bombardment on Si(100)
This application demonstrates an advanced Surface Process Simulation (SPS) technique for studying atomic layer etching (ALE) processes involving sequential Cl2 adsorption and Ar ion bombardment on silicon surfaces. The simulation captures the complete ALE cycle including chlorine saturation, argon-induced etching, and surface regeneration to study selectivity, etch rates, and surface chemistry evolution in semiconductor processing applications.
Important
QuantumATK Version: This application is designed for QuantumATK X-2025.06.
This application requires QuantumATK’s Surface Process Simulation framework and includes advanced analysis scripts for ALE characterization. You can download the required files below:
SPS_Si100_Cl2_300K_Ar_100eV_ALE_results.py- Complete ALE simulation scriptCl_saturation_plot.py- Chlorine saturation analysisEtch_plot.py- Etching depth analysisImpactsVsuptake_plot.py- Impact-uptake correlation analysisSPS_Si100_Cl2_300K_Ar_100eV_ALE.hdf5- Nanolab workflow file for ALE simulation
Key Features
Complete ALE cycle: Sequential Cl2 adsorption followed by Ar ion bombardment
Saturation analysis: Real-time monitoring of chlorine surface coverage and saturation behavior
Selective etching: Study of preferential etching mechanisms and surface selectivity
Cyclic processing: Multiple ALE cycles to study steady-state behavior and surface evolution
Advanced analysis: Automated extraction of etch rates, selectivity factors, and surface composition
System Overview
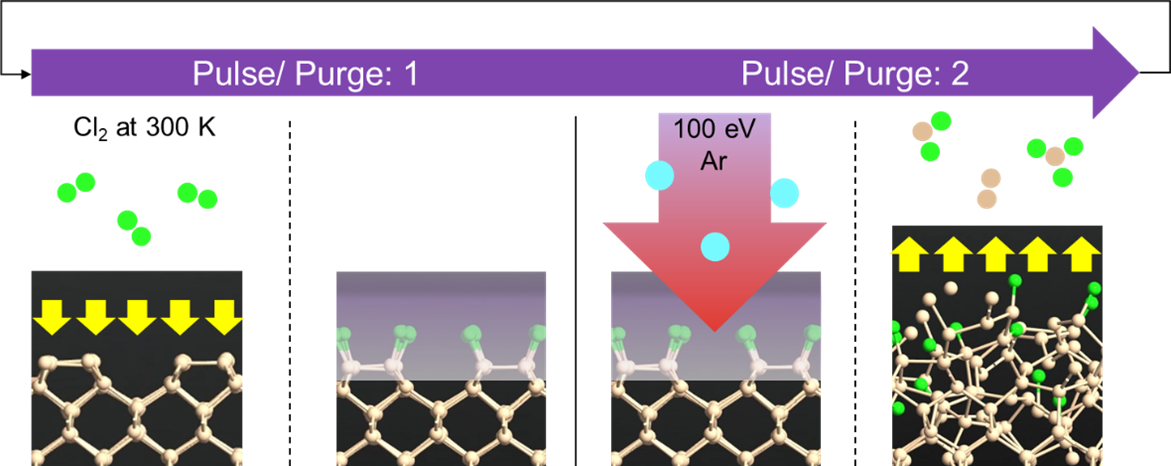
ALE Process Schematic: The ALE cycle consists of two distinct phases - chlorine adsorption (chemical modification) and argon bombardment (physical removal), enabling precise atomic-scale control of silicon etching.
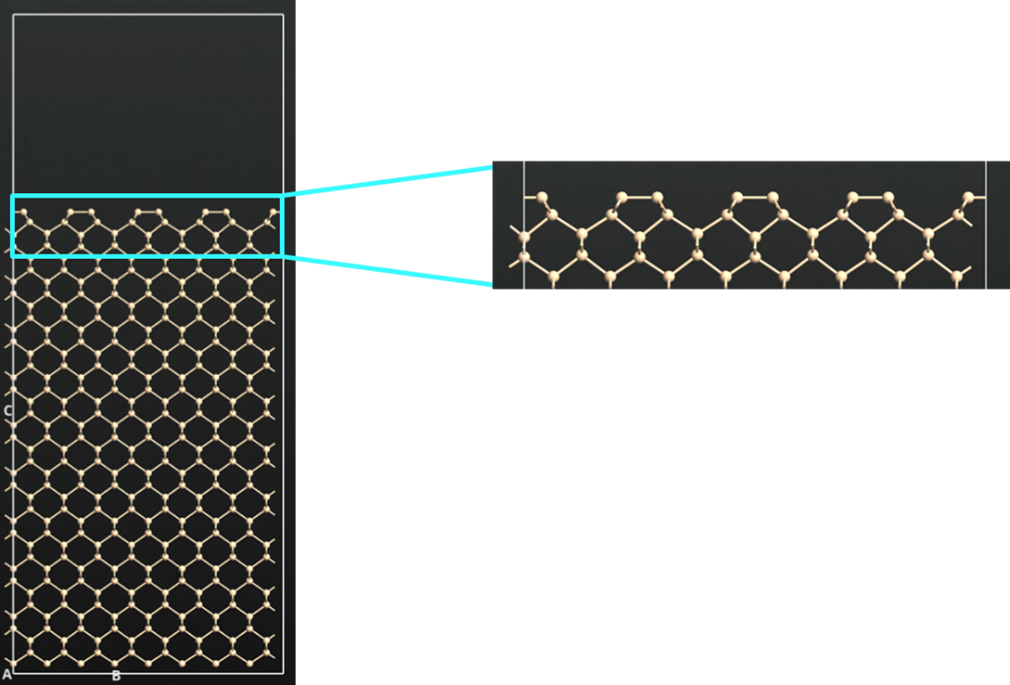
The simulated system consists of a silicon (100) surface optimized for ALE studies:
Surface Structure: Si(100) 2×1 reconstructed surface with periodic boundary conditions
Dimensions: 15.36 Å × 15.36 Å × 48.01 Å supercell
Temperature Control: 300 K substrate temperature maintained throughout ALE cycles
Surface Preparation: Clean silicon surface with proper 2×1 dimer reconstruction
ALE Process Parameters:
Chlorine Adsorption Phase: Thermal energy applied for chlorine molecules (300 K)
Ar Bombardment Phase: 100 eV argon ions with controlled flux and angle
Cycle Timing: Sequential exposure with complete separation between chemical adsorption and physical removal phases
Surface Regeneration: Automatic surface cleaning and preparation between cycles
Simulation Workflow
Step 0: Choice of Calculator
Before starting the simulation workflow, select an appropriate calculator for energy, force, and trajectory calculations. The choice depends on the desired accuracy and available computational resources.
Common options include:
Classical Force Fields: Suitable for large-scale simulations and rapid prototyping (e.g., Tersoff, Stillinger-Weber for Si).
Density Functional Theory (DFT): Provides higher accuracy for electronic structure and reaction mechanisms, but is computationally more demanding.
Machine-Learned Potentials: Combine speed and accuracy for specific systems.
Targeted MLFF (e.g., MTP): Machine-learned force fields such as Moment Tensor Potentials (MTP) are trained on data specific to a given material or process, offering high accuracy for that system but limited transferability to other chemistries or environments.
Universal MLFF (e.g., MACE, MatterSim, etc.): Universal machine-learned force fields are trained on large, diverse datasets to provide broad applicability across many materials and chemistries. They offer greater transferability but may be less accurate for highly specialized systems compared to targeted MLFFs.
Assign the calculator to your configuration before proceeding with surface preparation and subsequent simulation steps.
potentialSet = TremoloXPotentialSet(name='TersoffBrenner_ClFSi_2003+Moliere')
The Moliere potential is used in this setup to model the short-range repulsive interactions between argon (Ar) and other elements in the system, ensuring accurate description of ion-surface collisions during bombardment.
Step 1: Surface Preparation and Equilibration
The simulation begins with proper preparation of the Si(100) surface including reconstruction and thermal equilibration:
The silicon surface is initially optimized to achieve the correct 2×1 reconstruction characteristic of clean Si(100). Note that buckled reconstructed layer is not observed with the forcefield chosen for this study. Following optimization, a two-stage molecular dynamics equilibration is performed:
Stage 1: Heating from 10 K to 300 K
The optimized surface undergoes gradual heating using controlled molecular dynamics:
Ensemble: NVT
Initial temperature: 10 K with Maxwell-Boltzmann velocity distribution
Heating rate: 2.9 K/ps
Time step: 0.5 fs
Total steps: 200,000 (100 ps total simulation time)
Purpose: Controlled heating prevents structural damage while bringing the surface to the target temperature
Stage 2: Equilibration at 300 K
Following the heating phase, the surface is equilibrated at constant temperature:
Ensemble: NVT
Temperature: 300 K (constant)
Time step: 0.5 fs
Total steps: 200,000 (100 ps total simulation time)
Purpose: Ensures proper thermal motion, surface relaxation, and establishes realistic surface reactivity and adsorption site availability for subsequent ALE processing
Step 2: Chlorine Adsorption Phase
The first phase of each ALE cycle involves controlled exposure to Cl2 molecules:
- Chlorine Molecular Setup:
Chlorine molecules are positioned 10 Å above the surface with thermal kinetic energy distributions. The molecular orientation is randomized to ensure statistical sampling of different adsorption pathways.
Surface Process Simulation Parameters:
# Chlorine adsorption - Surface Process Simulation
surface_process_simulation = SurfaceProcessSimulation(
    substrate=substrate_configuration,
    filename='SPS_Si100_Cl2_300K_Ar_100eV_ALE_results.hdf5',
    temperature=300.0 * Kelvin,
    fixed_thickness=1.0 * Angstrom,
    thermostat_thickness=5.0 * Angstrom,
    fixed_directions=(2,),
)

surface_process_simulation.addSequence(
    molecule=cl2,
    number_of_events=250,
    md_time=10.0 * picoSecond,
    time_step=1.0 * femtoSecond,
    mean_kinetic_energy=300.0 * kBK,
    mean_incident_angle=0.0 * Degrees,
    internal_energy=300.0 * Kelvin,
)
Substrate temperature: 300 K
Fixed layer thickness: 1.0 Å (bottom atoms held fixed)
Thermostat thickness: 5.0 Å (temperature control region)
Fixed directions: z-direction (prevents lateral drift)
Cl₂ Adsorption Sequence:
Molecule: Cl₂ (chlorine dimer)
Number of events: 250 (molecular impacts per cycle)
MD time per event: 10.0 ps
Time step: 1.0 fs
Mean kinetic energy: 300 K thermal energy (0.026 eV)
Incident angle: 0° (normal to surface)
Internal energy: 300 K (molecular vibration/rotation)
- Adsorption Process:
The Surface Process Simulation tracks molecular dissociation, atomic adsorption, and surface saturation. Number of events are chosen to ensure saturation of the surface. More events would be needed if we increase the surface area. Cl2 molecules undergo dissociative adsorption on silicon dangling bonds, forming Si-Cl bonds and modifying surface reactivity.
Step 3: Argon Ion Bombardment Phase
The second phase involves controlled Ar ion bombardment to remove the chlorinated surface layer:
- Ar Ion Parameters:
Argon ions are generated with 100 eV kinetic energy and directed toward the chlorinated surface. The ion flux and angular distribution are controlled to achieve selective removal of chlorinated species while minimizing damage to the underlying silicon.
# Argon bombardment - Surface Process Simulation
surface_process_simulation_1 = SurfaceProcessSimulation(
    substrate=substrate_configuration,
    filename='SPS_Si100_Cl2_300K_Ar_100eV_ALE_results.hdf5',
    temperature=300.0 * Kelvin,
    fixed_thickness=1.0 * Angstrom,
    thermostat_thickness=5.0 * Angstrom,
    fixed_directions=(2,),
)

surface_process_simulation_1.addSequence(
    molecule=ar,
    number_of_events=250,
    md_time=10.0 * picoSecond,
    time_step=1.0 * femtoSecond,
    mean_kinetic_energy=100.0 * eV,
    mean_incident_angle=0.0 * Degrees,
    internal_energy=300.0 * Kelvin,
)
Surface Process Simulation Parameters:
Substrate temperature: 300 K
Fixed layer thickness: 1.0 Å (bottom atoms held fixed)
Thermostat thickness: 5.0 Å (temperature control region)
Fixed directions: z-direction (prevents lateral drift)
Ar Bombardment Sequence:
Molecule: Ar (argon atom)
Number of events: 250 (ion impacts per cycle)
MD time per event: 10.0 ps
Time step: 1.0 fs
Mean kinetic energy: 100 eV (high-energy ion bombardment)
Incident angle: 0° (normal to surface)
- Etching Mechanism:
The bombardment process preferentially removes Si-Cl species through momentum transfer and chemical enhancement. The etching selectivity can be quantified by comparing removal rates of chlorinated versus non-chlorinated surface species, providing insights into the chemical enhancement factor. Ar impacts on Si alone should result in lower or no etching compared to chlorinated surfaces.
Step 4: Post-Processing Analysis
After the complete simulation (all ALE cycles) has finished, comprehensive post-processing analysis is performed using the provided Python analysis scripts. These scripts read the saved trajectory data and extract key performance metrics from the HDF5 output file.
Cl_saturation_plot.py - Chlorine Saturation Analysis
This script analyzes the chlorine adsorption behavior during the ALE cycles. This script can be executed while the simulation is running to monitor saturation in real-time.
Inputs:
HDF5 trajectory files: Cl_pulse_1.hdf5, Cl_pulse_2.hdf5, Cl_pulse_3.hdf5, Cl_pulse_4.hdf5
Monolayer reference: 16 atoms (number of surface Si atoms in the simulation cell)
Surface area: Calculated from primitive lattice vectors (15.36 × 15.36 Ų)
Analysis Performed:
Reads SurfaceProcessSimulation trajectories from each Cl₂ pulse cycle
Cleans vacuum region to remove unreacted molecules
Counts chlorine atoms after each molecular impact event
Calculates fluence (impacts/area) in units of nm⁻²
Normalizes chlorine uptake to monolayer coverage
Outputs:
Fluence vs. Uptake plot: Shows chlorine coverage evolution as a function of molecular dose for each pulse
Saturation behavior: Reveals self-limiting adsorption characteristic of ALE processes
Demonstrates convergence to ~0.8-1.0 monolayer saturation coverage
Etch_plot.py - Etching Depth Analysis
This script quantifies the silicon removal during Ar ion bombardment phases.
Inputs:
HDF5 trajectory files: Alternating Cl and Ar pulse files
Cl_pulse_1.hdf5, Ar_pulse_1.hdf5, Cl_pulse_2.hdf5, Ar_pulse_2.hdf5, Cl_pulse_3.hdf5, Ar_pulse_3.hdf5, Cl_pulse_4.hdf5, Ar_pulse_4.hdf5
Monolayer parameters: 16 atoms/monolayer, 0.136 nm/monolayer thickness
Substrate definition: 16 monolayers total in the pristine substrate
Analysis Performed:
Reads trajectories from both Cl₂ adsorption and Ar bombardment phases sequentially
Cleans vacuum region to count only substrate atoms
Counts remaining silicon atoms after each impact event
Calculates cumulative etch depth by comparing to pristine surface (16 monolayers)
Tracks material removal as a function of total impact number
Outputs:
Etch depth vs. Impact number plot: Shows cumulative silicon removal over all cycles
Etch per cycle (EPC) values: Quantifies the thickness removed per ALE cycle (typically in nm/cycle)
Steady-state behavior: Demonstrates reproducible etching after initial transient cycles
ImpactsVsuptake_plot.py - Impact-Uptake Correlation Analysis
This script correlates the number of molecular/ion impacts with chlorine uptake and material removal throughout the ALE cycles.
Inputs:
HDF5 trajectory files: Alternating Cl and Ar pulse files
Cl_pulse_1.hdf5, Ar_pulse_1.hdf5, Cl_pulse_2.hdf5, Ar_pulse_2.hdf5, Cl_pulse_3.hdf5, Ar_pulse_3.hdf5, Cl_pulse_4.hdf5, Ar_pulse_4.hdf5
Monolayer reference: 16 atoms (surface Si atoms in simulation cell)
Fuzz factor: 1.15 (for vacuum region identification)
Analysis Performed:
Reads trajectories from both Cl₂ and Ar phases sequentially
Cleans vacuum region after each impact event
Counts chlorine atoms throughout the entire ALE sequence
Tracks chlorine uptake normalized to monolayer coverage
Shows cyclic behavior of Cl adsorption (increasing) and removal (decreasing) phases
Outputs:
Uptake vs. Impact number plot: Shows cyclic chlorine coverage evolution across all impacts
Cyclic behavior visualization: Demonstrates the saw-tooth pattern of Cl adsorption during Cl₂ pulses and removal during Ar pulses
Self-limiting behavior: Shows saturation during adsorption and efficient removal during bombardment
Analysis and Observations
Chlorine Saturation Behavior
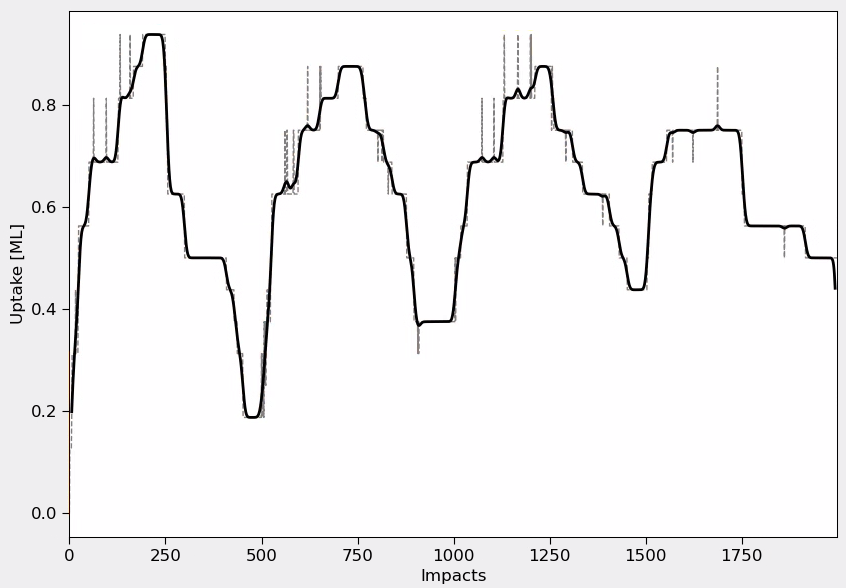
Fig. 148 Chlorine Uptake Analysis: The plot shows the cyclic evolution of chlorine coverage throughout multiple ALE cycles. The saw-tooth pattern demonstrates Cl₂ adsorption (rising edges) and Ar-induced removal (falling edges). A rolling average is applied to smooth the curve fluctuations.
The chlorine saturation analysis reveals the self-limiting nature of the adsorption process. Initial rapid uptake occurs on high-reactivity dangling bond sites, followed by slower saturation as steric hindrance limits additional adsorption. The saturation coverage typically reaches 0.8-1.0 monolayers depending on surface temperature and molecular flux conditions.
The cyclic behavior clearly shows:
Adsorption phase: Rapid Cl uptake during Cl₂ pulse reaching near-monolayer saturation
Removal phase: Efficient chlorine removal during Ar bombardment, resetting the surface
Reproducibility: Consistent cycle-to-cycle behavior after initial transients
Self-limiting nature: Saturation plateau indicating controlled ALE process
Note
The curve fluctuations visible in the plot are due to the limited sampling in this small-scale demonstration. Smoother curves can be obtained by using larger surface areas (increasing supercell dimensions) which provide better statistical sampling with the same number of impact events per unit area. Also, increaing the thickness of the substrate can allow for multiple cycles of bombardment without reaching the bottom fixed layer, improving accuracy.
Etching Yield and Material Removal
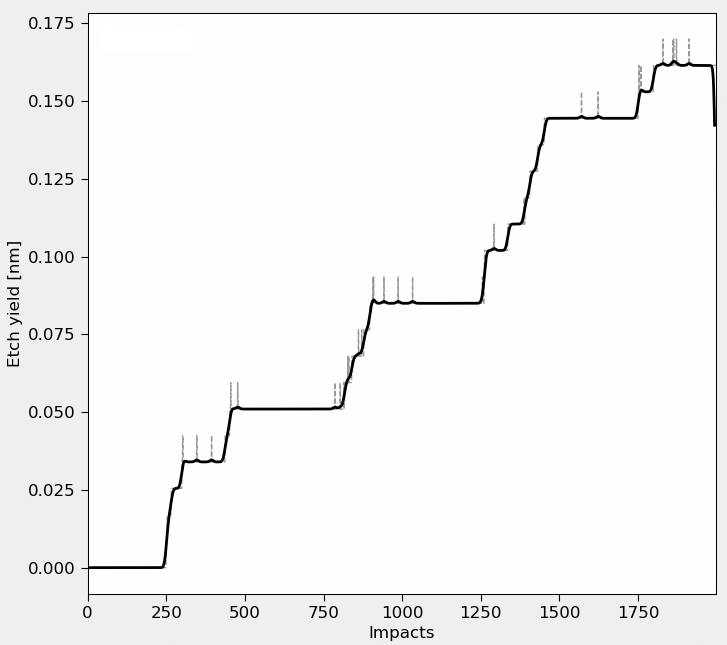
Fig. 149 Etch Yield Analysis: The plot shows cumulative silicon removal as a function of total impact number (both Cl₂ and Ar). The step-like behavior reflects alternating adsorption (no etching) and bombardment (active etching) phases. A rolling average highlights the overall etching trend.
The etching analysis demonstrates significant chemical enhancement during the Ar bombardment phases:
Chemical enhancement: High etch rates during Ar bombardment of chlorinated surfaces compared to negligible etching during Cl₂ exposure alone
Selectivity: There is a 1:1 correspondence to Cl uptake and Si removal, indicating preferential etching of chlorinated species. In the final pulse, not a lot of Cl is adsorbed and hence minimal etching is observed.
Note
The step-like features in the Ar pulse region of raw data reflect the discrete nature of molecular/ion impact events in this small simulation cell. Larger systems with more surface atoms would provide smoother curves due to improved statistical averaging, though the underlying physics and cyclic behavior remain the same.
Customization Options
Process Parameter Optimization
Large Systems: The simulation framework can be scaled to larger surface areas by increasing the supercell dimensions and adjusting the number of molecular/ion impacts accordingly. This should give smoother curves in the analysis due to increased sampling.
Temperature Effects: The simulation can be adapted for different substrate temperatures (200-500 K) to study temperature-dependent adsorption and desorption kinetics.
Ion Energy Studies: Argon bombardment energy can be varied (50-200 eV) to optimize the balance between selectivity and etch rate.
Alternative Chemistries: The framework supports other halogen chemistries (Br2, I2) and different ion species (Ne, Kr) for comparative studies.
Cycle Timing Optimization
Adsorption Time: The Cl2 exposure time can be optimized to achieve complete saturation while minimizing process time.
Bombardment Dose: The argon ion dose per cycle and impact angle can be optimized to acieve faster etching while preserving surface integrity.
Output Files
The simulation generates comprehensive output files for detailed analysis:
SPS_Si100_Cl2_300K_Ar_100eV_ALE_results.hdf5: Complete simulation trajectories and configuration data
uptake_plot.hdf5: Chlorine uptake and saturation curves as a function of impact number and cycle
etch_plot.hdf5: Silicon removal rates as a function of impact number and cycle
Using the NanoLab Workflow
The application includes pre-configured NanoLab workflow blocks for:
Surface preparation and equilibration setup
Cl2 molecule configuration and bombardment parameters
Ar ion setup with energy and flux specifications
looping over multiple ALE cycles
Running the Script
Execute the complete ALE simulation:
atkpython SPS_Si100_Cl2_300K_Ar_100eV_ALE_results.py
We recommend using the Jobs tool and run on HPC cluster for faster execution.
Generate analysis plots in the same folder as output files from the above command:
atkpython Cl_saturation_plot.py
atkpython Etch_plot.py
atkpython ImpactsVsuptake_plot.py
Performance Considerations
Computational Requirements: The ALE simulation requires significant computational resources due to the multiple cycles and many impact events.
Memory Usage: ~11 GB harddisk space required for trajectory and analysis files. Since force field calculations are used, memory requirements are moderate compared to ab initio methods.
Computational Time: It took 21 hours using 1 MPI and 20 OpenMP threads.
Summary
This application example provides a complete framework for studying ALE processes using Surface Process Simulation. The sequential Cl2 adsorption and Ar bombardment approach enables detailed investigation of:
Chemical enhancement mechanisms in atomic layer etching
Saturation behavior and self-limiting surface chemistry
Cyclic process optimization for precise atomic-scale control
Surface morphology evolution during ALE processing
The included analysis scripts provide automated extraction of key ALE performance metrics, making this a valuable tool for both fundamental research and process development applications in semiconductor manufacturing.
Note
Large-Scale Simulation Results: check out the Synopsys QuantumATK whitepaper which demonstrates large-scale surface process simulations for Si ALE.